 Alerua
Radar basics
How to read weather radar
What a radar map shows, what the colors mean, and how to follow a storm in a loop.
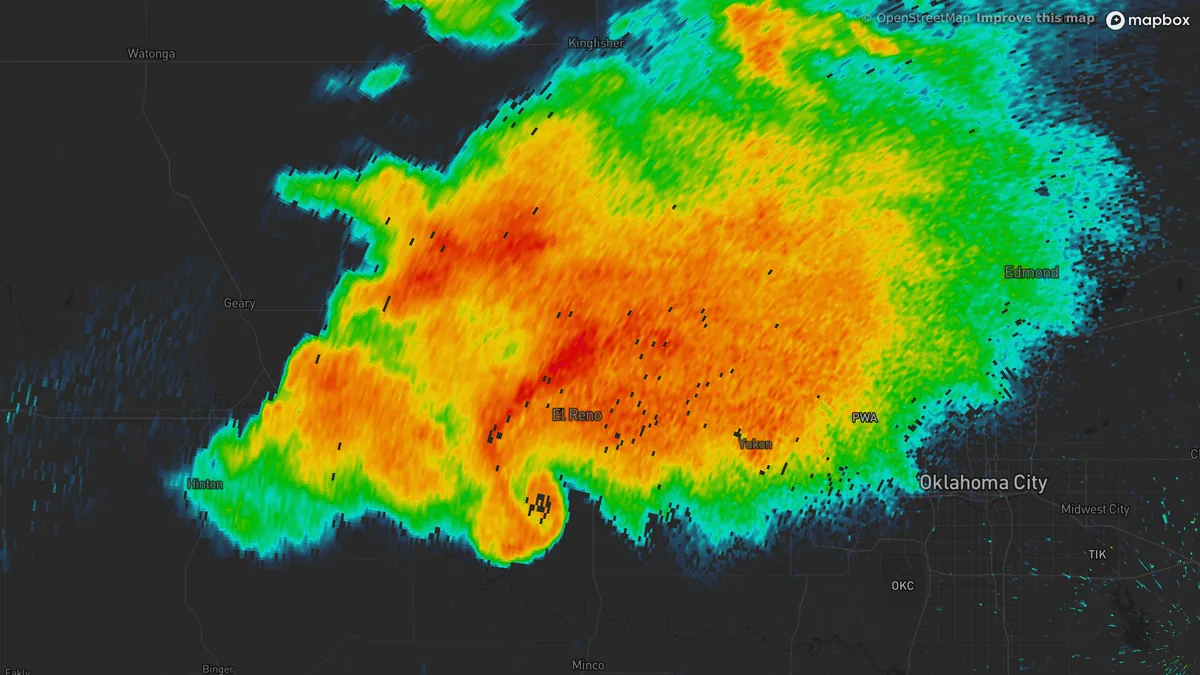
- KTLX Norman, Oklahoma
- 6:14 PM CDT, May 31, 2013
- 0.5° tilt
- Reflectivity
What a weather radar measures
The radar sends out a short pulse and waits. Anything in the air big enough to scatter it returns a little of the energy: raindrops, hailstones, snowflakes, insects, birds, smoke, dust and, near the radar, the ground. The delay gives the distance, the direction the dish was pointing gives the bearing, and the strength of the echo says how much of it is out there. That strength is reflectivity, the first view on any radar map.
The radar also measures whether each echo is moving toward it or away from it, from the Doppler shift in the returning pulse. That is velocity. The 159 US radars of the NEXRAD network also send pulses in two polarizations and compare the echoes, which says something about the shape of whatever is in the beam. That is dual-polarization.
One radar turns a full circle at a low angle, tilts up a notch and turns again: 14 or 15 turns in rain, 5 to 9 in clear air. The full set is a volume scan. It takes four to six minutes in rain and up to ten when the air is clear, so every frame on a radar map is already a few minutes old when you see it.
What the colors on weather radar mean
On the standard radar map, color shows reflectivity, measured in dBZ. The scale is logarithmic, so every 10 dBZ is ten times the returned power: a 50 dBZ echo is a hundred times stronger than a 30. More drops, and bigger drops, send back more, so higher numbers and warmer colors usually mean heavier rain.
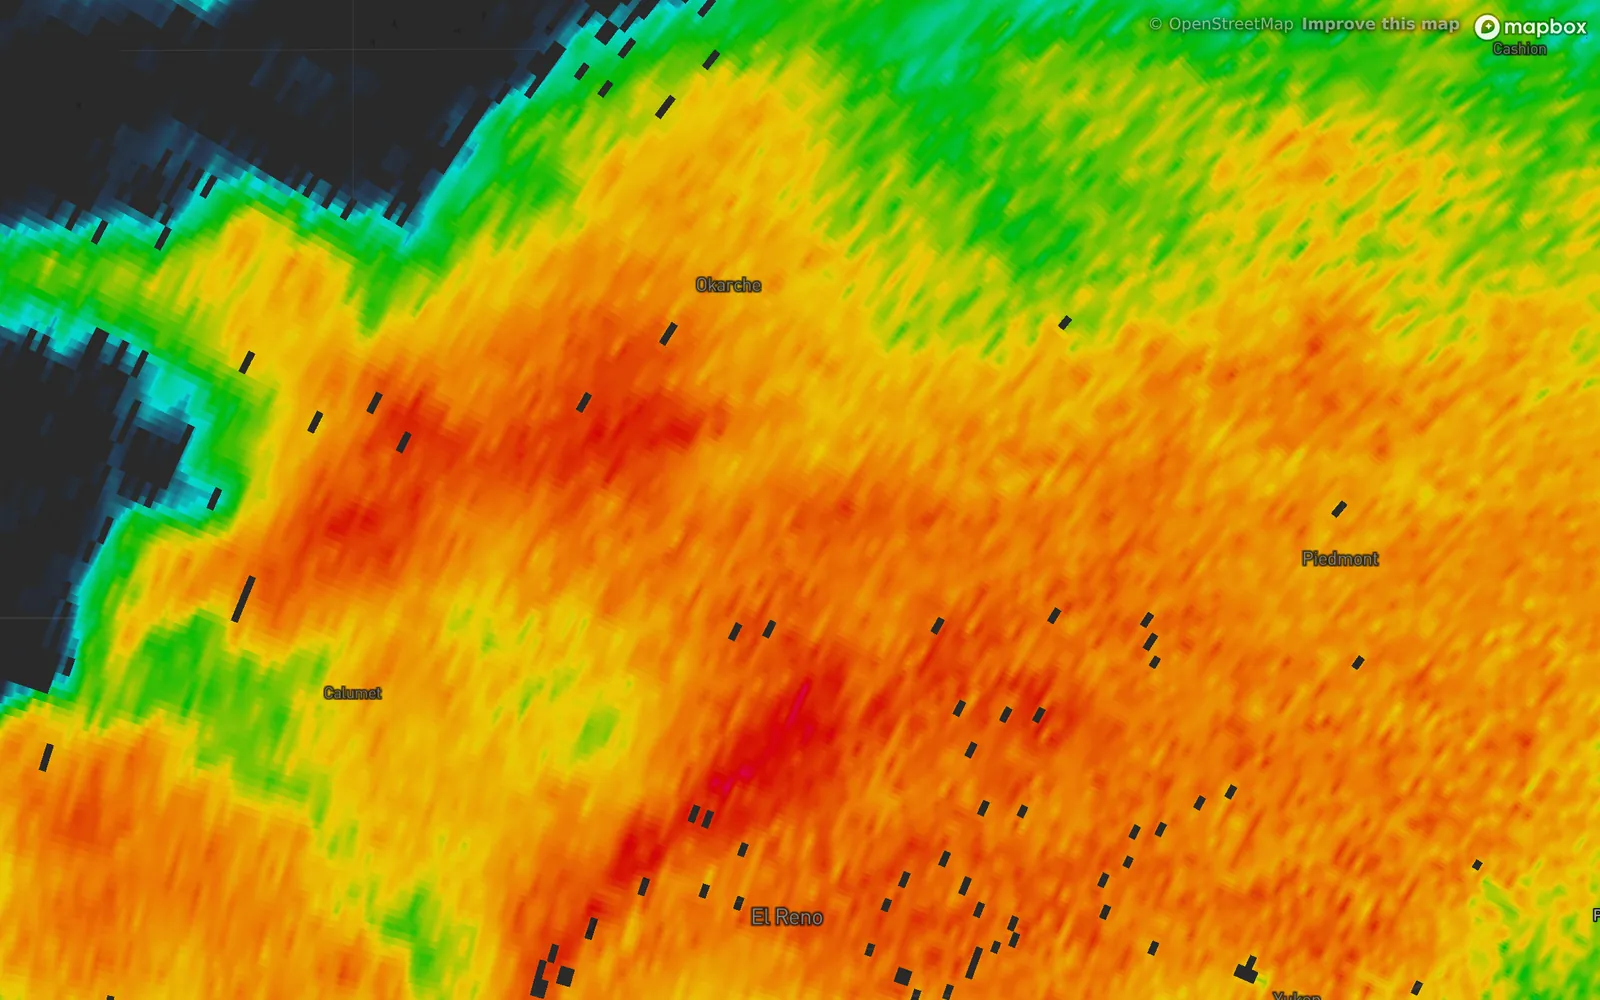
- KTLX Norman
- 6:14 PM CDT, May 31, 2013
- Reflectivity, Classic colors
- 1About 20 dBZ, cyan
- 2About 30 dBZ, green
- 3About 40 dBZ, yellow
- 4About 50 dBZ, orange
- 5About 60 dBZ, red
| Color | dBZ | Usually means | Inches per hour* |
|---|---|---|---|
| Blue | 5 to 15 | Drizzle, a few snowflakes, or not precipitation at all: insects, dust, birds. | under 0.01 |
| Cyan | 20 | Light rain or snow. | 0.02 |
| Green | 30 | Steady, moderate rain. | 0.09 |
| Yellow | 40 | Heavy rain. | 0.5 |
| Orange | 50 | Very heavy rain. Small hail is possible. | 2.5 |
| Red | 60 | Intense. Hail is likely mixed in with the rain. | not reliable |
| Magenta, purple | 65 and up | The strongest returns: large hail or a very dense core. | not reliable |
*From the standard US conversion, Z = 300 R1.4, assuming all of it is rain. Hail breaks the conversion, so there is no rate above 55 dBZ.
Hail is the biggest source of error. A lump of ice reflects far more than a drop of the same weight, so a red or purple core can mean hail, very heavy rain or both, and the dual-polarization views tell them apart.
Snow reflects much less than rain: ice returns about a fifth as much energy as water of the same size. A heavy snowfall may only reach 20 to 30 dBZ, and a weak-looking band can still bury a road.
The radar sees the sky at the height of its beam, and the beam climbs with distance. Rain can evaporate before it reaches the ground, which is why a map sometimes shows rain over a dry yard, and some echoes are not rain at all.
Apps draw the same numbers in different palettes, so to compare two apps, compare the dBZ values.
How to read a radar loop
These six scans of the El Reno storm are about five minutes apart.
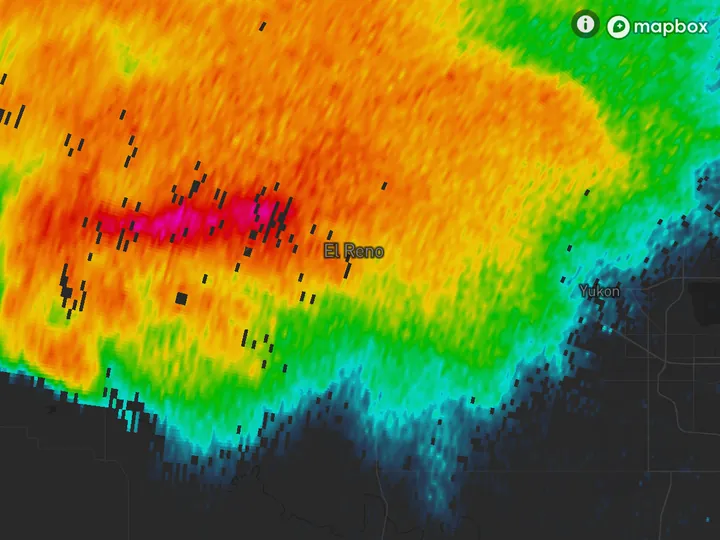
- 5:51 PM CDT
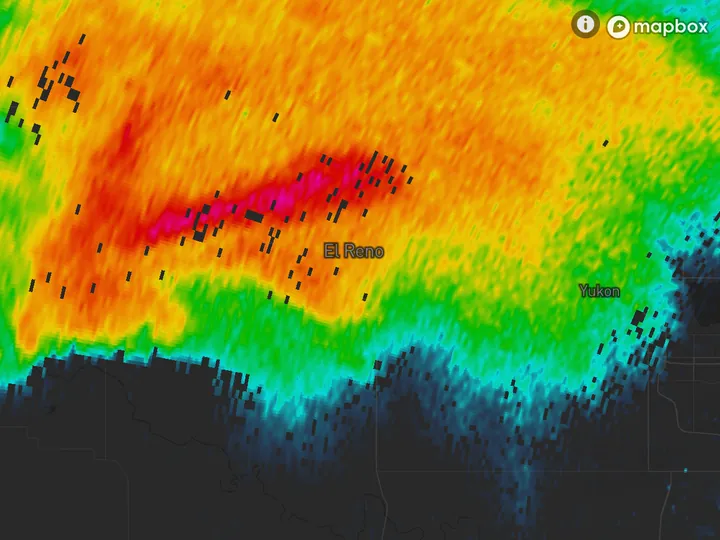
- 5:56 PM CDT
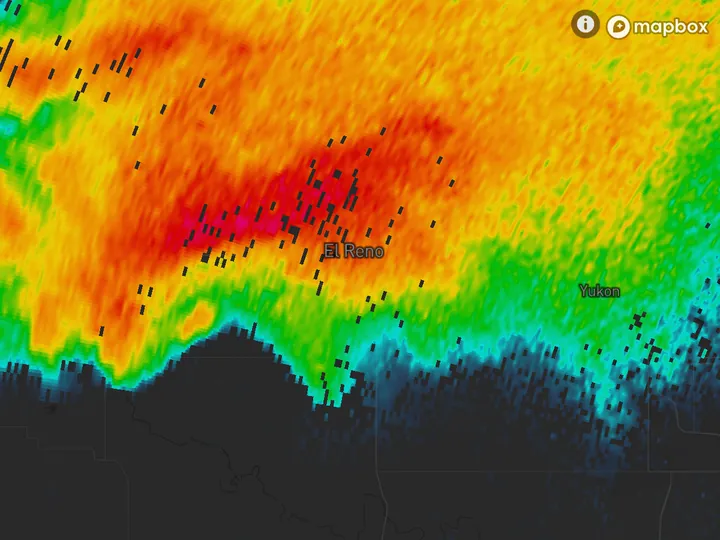
- 6:01 PM CDT
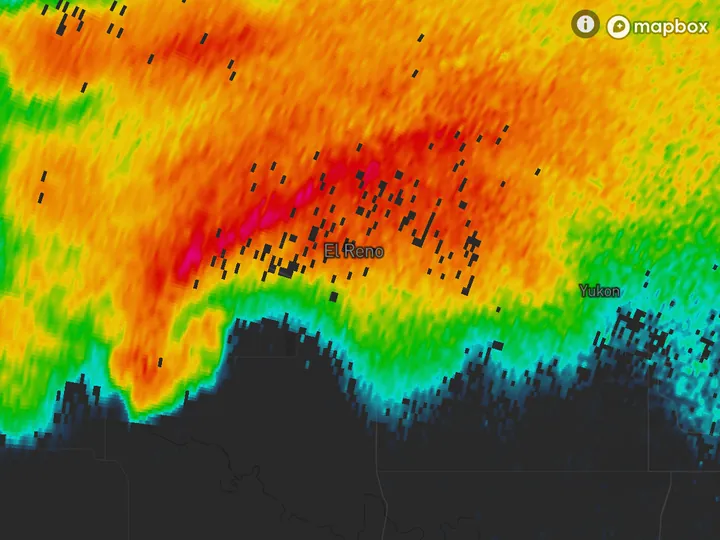
- 6:05 PM CDT
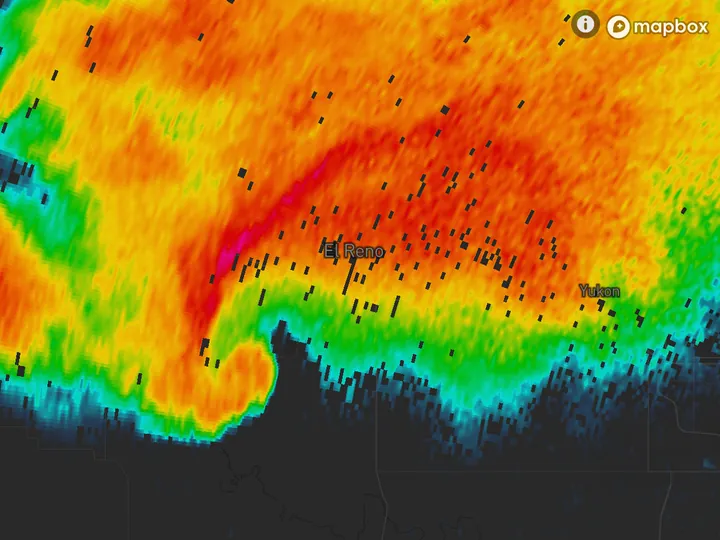
- 6:10 PM CDT
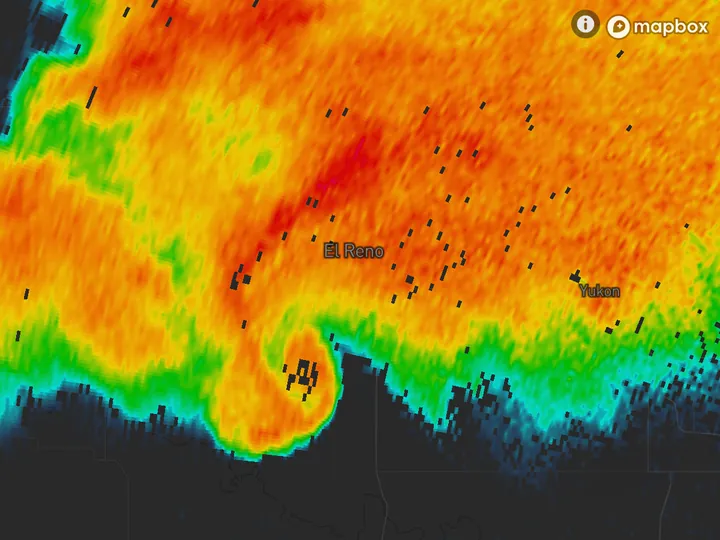
- 6:14 PM CDT
The National Weather Service puts the start of the tornado at 6:03 PM. The southwest edge bulges at 6:05, curls by 6:10 and is a hook at 6:14.
To get a storm’s motion, pick a feature you can follow, see how far it traveled between two scans, and divide by the time. A storm that moves 10 miles in 30 minutes is traveling at 20 mph. A core that keeps getting stronger and taller is growing, and one that is breaking up is weakening. A smooth edge that bulges and curls is how a hook forms.
Keep reading
- Doppler radarHow Doppler radar worksHow the radar measures wind, why it only sees motion toward or away, and where the reading breaks down.
- Severe weatherHow to spot a tornado on radarThe hook echo, the rotation pair on velocity and the debris signature.
- Winter weatherHow to tell rain from snow on radarWhy the colors look alike, how the correlation coefficient shows melting, and what the beam misses near the ground.
Further reading
- NOAA JetStream: how radar works
- NOAA JetStream: radar images, reflectivity
- NWS Warning Decision Training Division: reflectivity and rainfall rate
- NEXRAD Level II data on the Registry of Open Data on AWS
Radar data from NOAA’s NEXRAD Level II archive. Base map © Mapbox © OpenStreetMap contributors.