 Alerua
Using Alerua
How to use the Alerua radar map
Every control on the radar page, and what the tilts, color styles and clutter filter do to the picture.
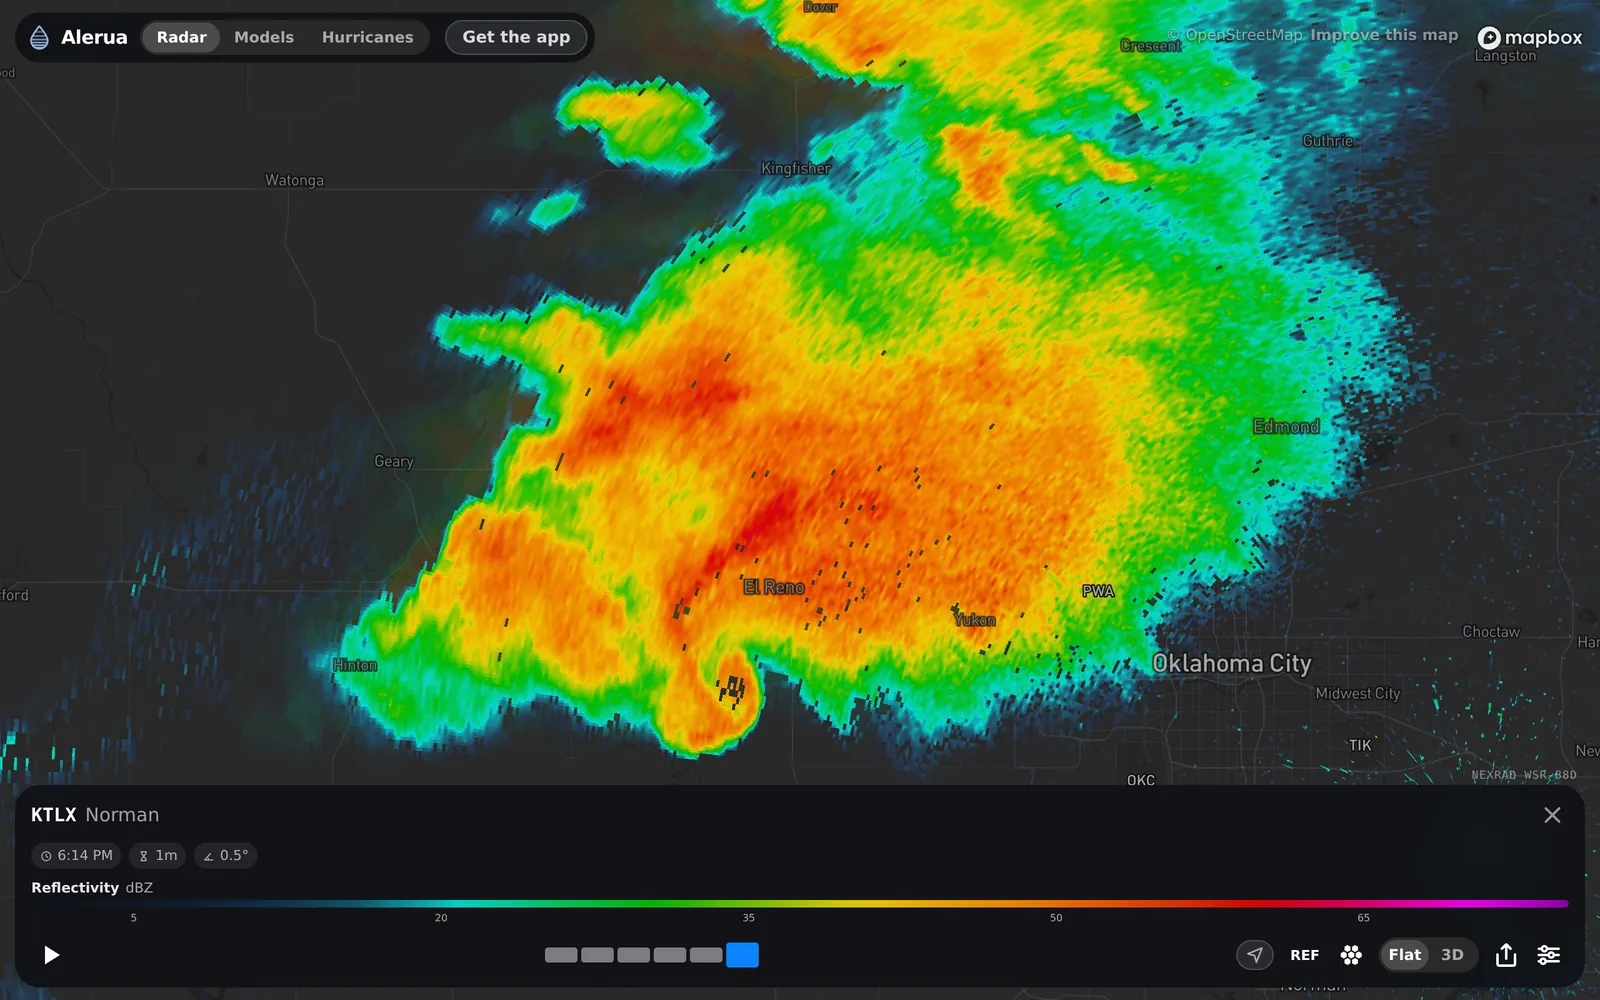
- 1Radar, Models, Hurricanes: the site’s three views.
- 2The radar you are on, by its four-letter code and the nearest town. Tap any dot on the map to switch.
- 3Scan time, age and tilt. The clock is when the radar finished the tilt on screen, in your own time zone, the hourglass how many minutes old it is, and the angle the tilt.
- 4The scale for the view you have chosen.
- 5Play and the timeline. One block per scan; the bright one is on the map.
- 6The controls.
The radar page is at alerua.com/map.
The controls
 Product. Picks the view: reflectivity, velocity, correlation coefficient and seven more.
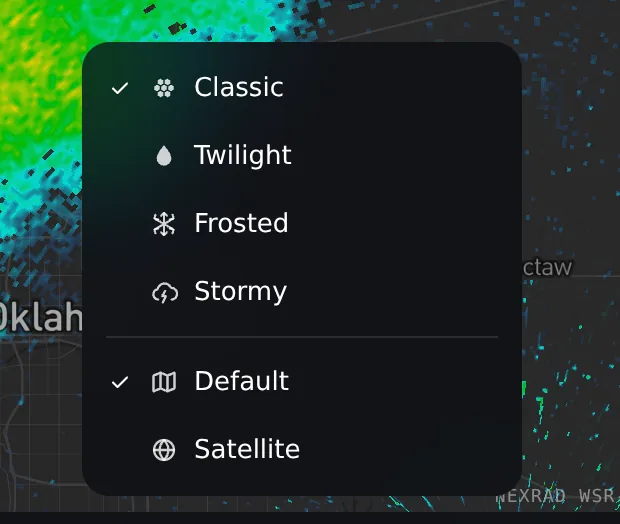
 Style. Classic, Twilight, Frosted or Stormy colors, and the base map.
 Flat or 3D. The flat map, or the scan as a 3D volume (3D opens in the app).
 Share. Shares the loop as an animated picture.
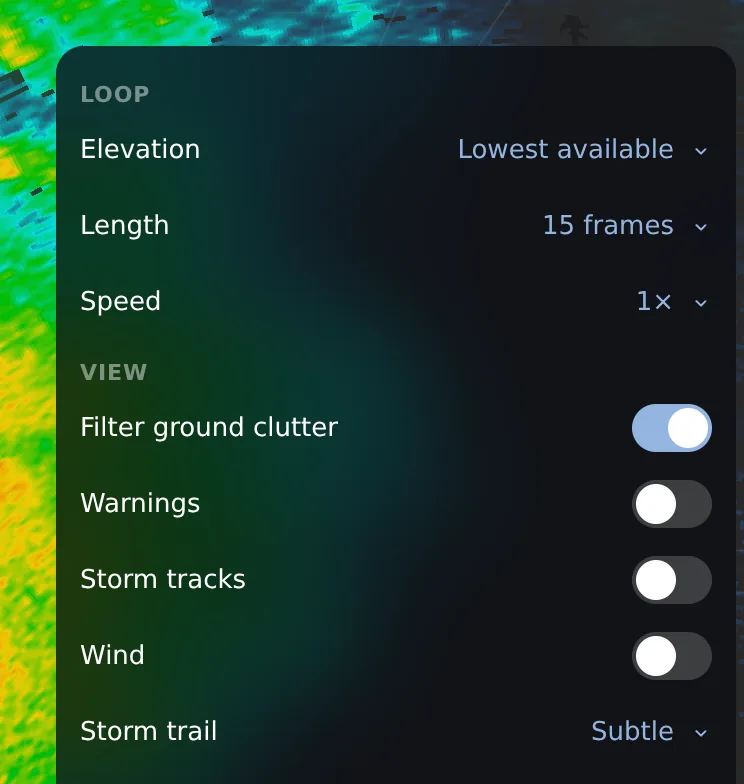
 Settings. Tilt, loop length and speed, the clutter filter, warnings, storm tracks and wind.
Tilts: what the beam can and can’t see
A radar can’t look along the ground. The beam leaves the dish tilted slightly upward and the Earth curves away beneath it, so the farther the beam travels, the higher it is. It also spreads: one degree wide is about 0.7 mile across at 40 miles. In Alerua, Settings, Elevation steps through the tilts, starting at the lowest.
Here is the El Reno storm, about 41 miles from the Norman radar, at three tilts within three minutes of each other.
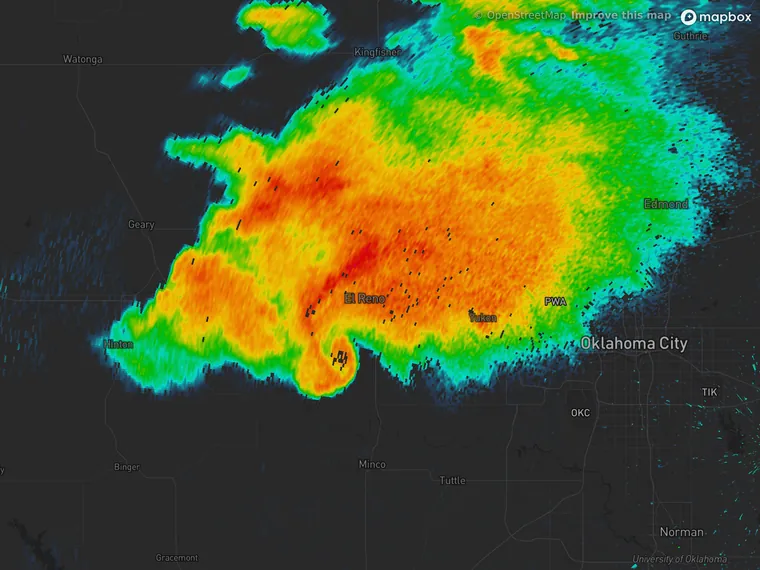
- 0.5° · about 3,000 ft up
- 6:14 PM
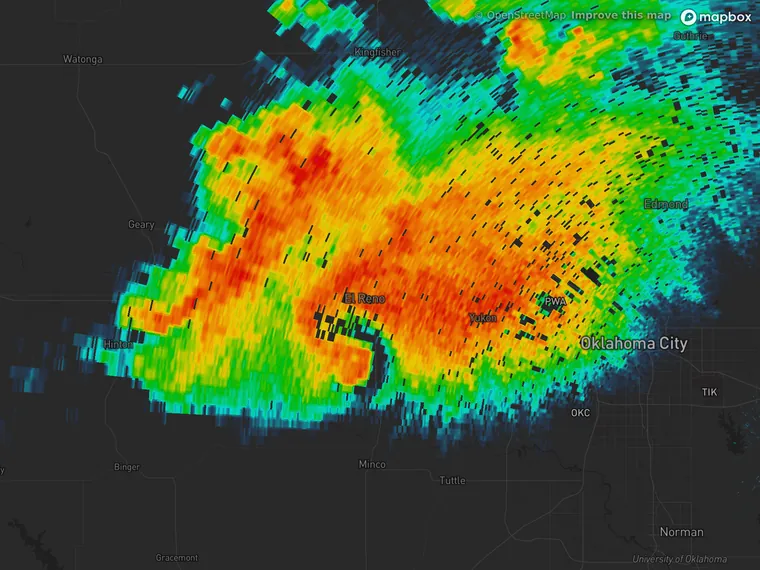
- 3.2° · about 13,000 ft up
- 6:17 PM
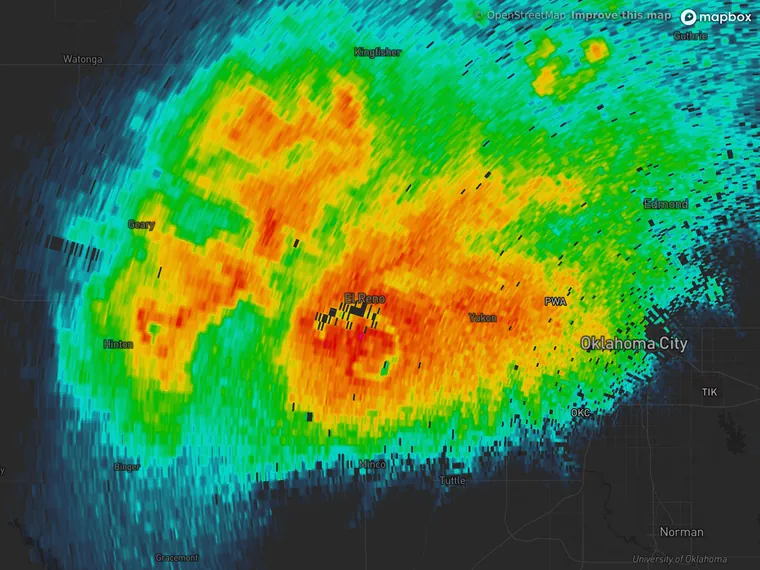
- 6.5° · about 25,000 ft up
- 6:17 PM
| Distance | Beam height | Beam width |
|---|---|---|
| 25 km (16 mi) | 0.25 km (840 ft) | 0.4 km (0.3 mi) |
| 50 km (31 mi) | 0.58 km (1,900 ft) | 0.9 km (0.5 mi) |
| 100 km (62 mi) | 1.5 km (4,800 ft) | 1.8 km (1.1 mi) |
| 150 km (93 mi) | 2.6 km (8,600 ft) | 2.6 km (1.6 mi) |
| 200 km (124 mi) | 4.1 km (13,400 ft) | 3.5 km (2.2 mi) |
| 230 km (143 mi) | 5.1 km (16,800 ft) | 4.0 km (2.5 mi) |
So a far storm is seen from higher up: low features such as hooks get hard to see at long range, and shallow rain can pass under the lowest beam. Far storms are also blurrier, because the beam is wider than what you are looking for. Right over the radar is a blind cone, because the highest tilt, 19.5°, can’t look straight up. That is why forecasters use the radar closest to a storm.
Flat or 3D
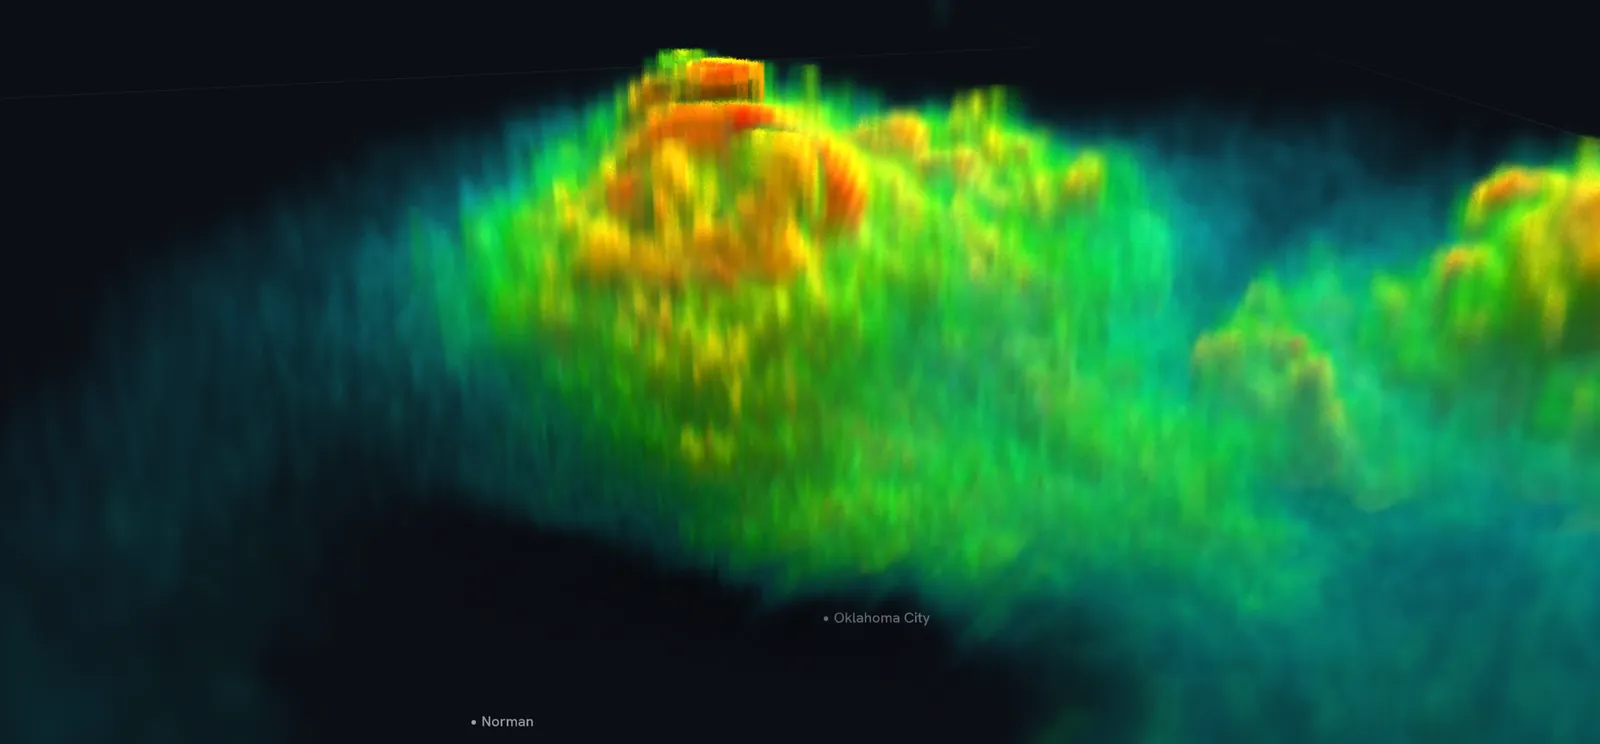
Stack all the tilts and you get the storm as a volume. That is what Alerua’s 3D view draws, in the iPhone and Mac apps.
Radar color styles: why the same storm can look different
Every radar app picks its own palette, so read the scale before trusting a color. Alerua has four; three are shown here on the same scan.
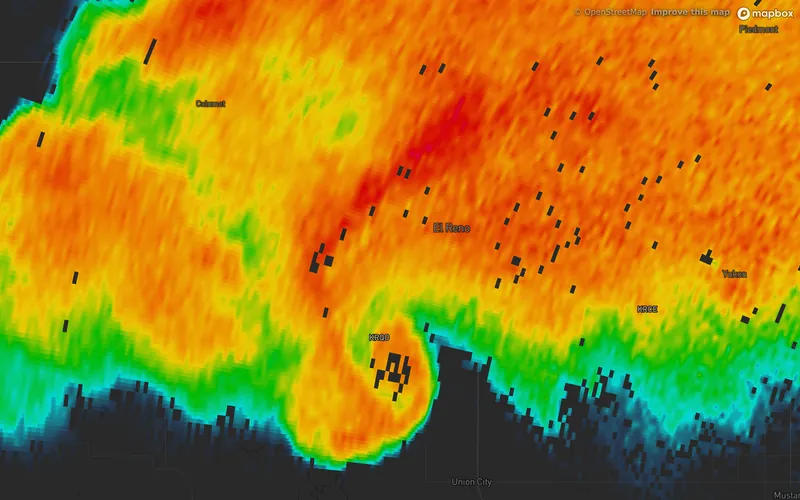
- Classic
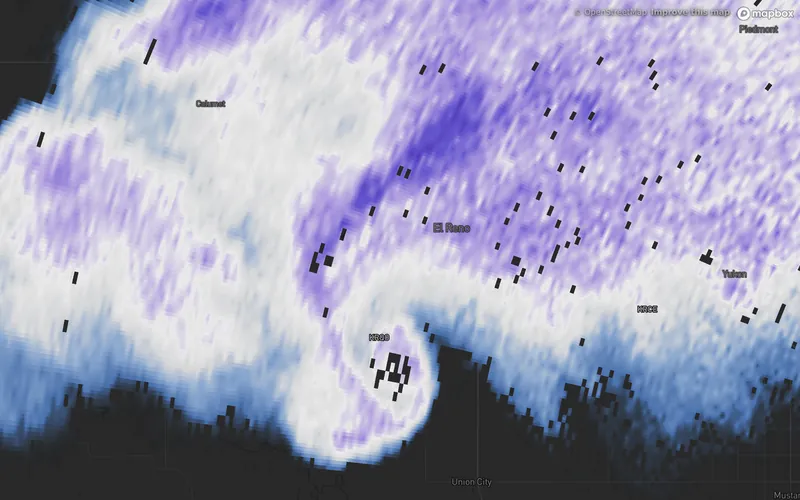
- Twilight
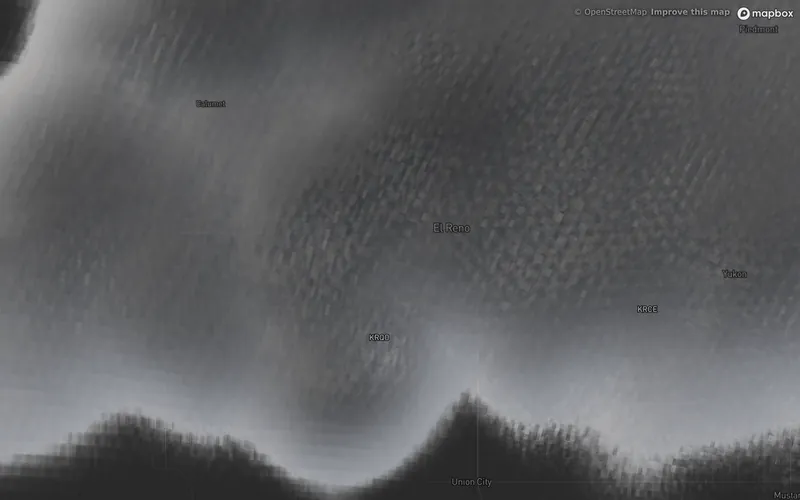
- Stormy
Settings
- Elevation picks the tilt.
- Filter ground clutter, on by default, hides gates with a correlation coefficient under 0.8. That clears birds, insects and clutter, and it also hides tornado debris.
- Warnings draws the National Weather Service’s tornado and severe thunderstorm polygons over the radar.
- Loop length and speed, storm tracks and wind are here too.
Keep reading
- Radar basicsHow to read weather radarWhat a radar measures, what the colors mean and how to read a loop.
- 3D radar3D weather radar, explainedHow a 3D view is built from the radar’s tilts, what it shows that a flat map can’t, and where it can mislead.
- Doppler radarHow Doppler radar worksHow the radar measures wind, why it only sees motion toward or away, and where the reading breaks down.
Further reading
Radar data from NOAA’s NEXRAD Level II archive. Base map © Mapbox © OpenStreetMap contributors.