 Alerua
Winter weather
How to tell rain from snow on radar
The reflectivity colors look the same for both. The correlation coefficient shows where snow is melting, and the beam can’t see the last stretch to the ground.
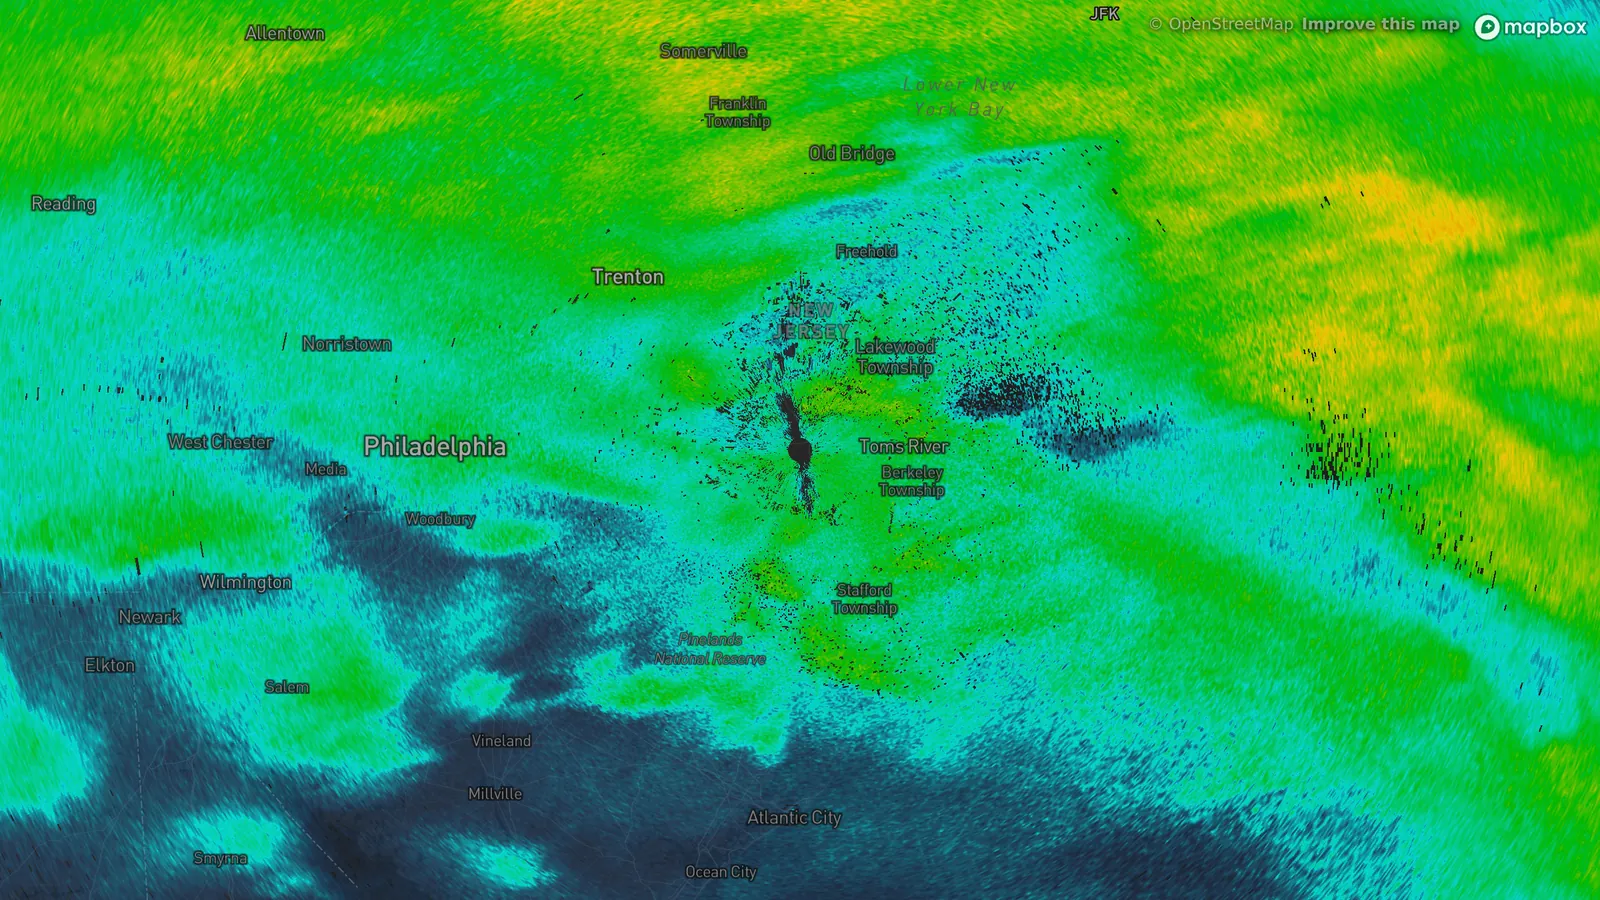
- KDIX Fort Dix, New Jersey
- 3:01 PM EST, November 15, 2018
- 0.4° tilt
- Reflectivity
- 1Trenton: snow, 30°F.
- 2Philadelphia airport: snow and sleet, 32°F.
- 3Wilmington: rain, 33°F.
Reflectivity looks the same
Reflectivity measures how much of the radar’s pulse comes back. Rain, snow and sleet all send some back, so the colors tell you how much is falling and nothing about its type.
At 3:01 PM EST on November 15, 2018 the radar at Fort Dix, New Jersey, showed one mass of cyan and green from Reading, Pennsylvania to the coast. Under it Trenton had snow at 30°F, Philadelphia’s airport had snow and sleet at 32°F and Wilmington, Delaware had rain at 33°F. All three sit under the same colors.
Snow does leave a trace. Dry snowflakes return a weak echo, and a flake coated in meltwater returns a much stronger one, so the layer where snow melts can show as a bright band on the higher tilts.
Correlation coefficient shows the melting
Correlation coefficient asks how alike the radar’s horizontal and vertical echoes are. Uniform rain or uniform snow reads near 1, and the National Weather Service treats anything above 0.97 as uniform. A melting flake is a mix of ice and water in odd shapes, which pulls the value down, to 0.90 or lower. Where the beam cuts through the melting layer the result is a ring of lower values around the radar.
The same scan shows one. In the gates from 10 to 30 km (6 to 19 miles) out, about a quarter read below 0.95, against about one in ten from 45 to 80 km. A ring that close to the radar means the melting layer was low, and under it Fort Dix itself reported snow and sleet at 32°F.
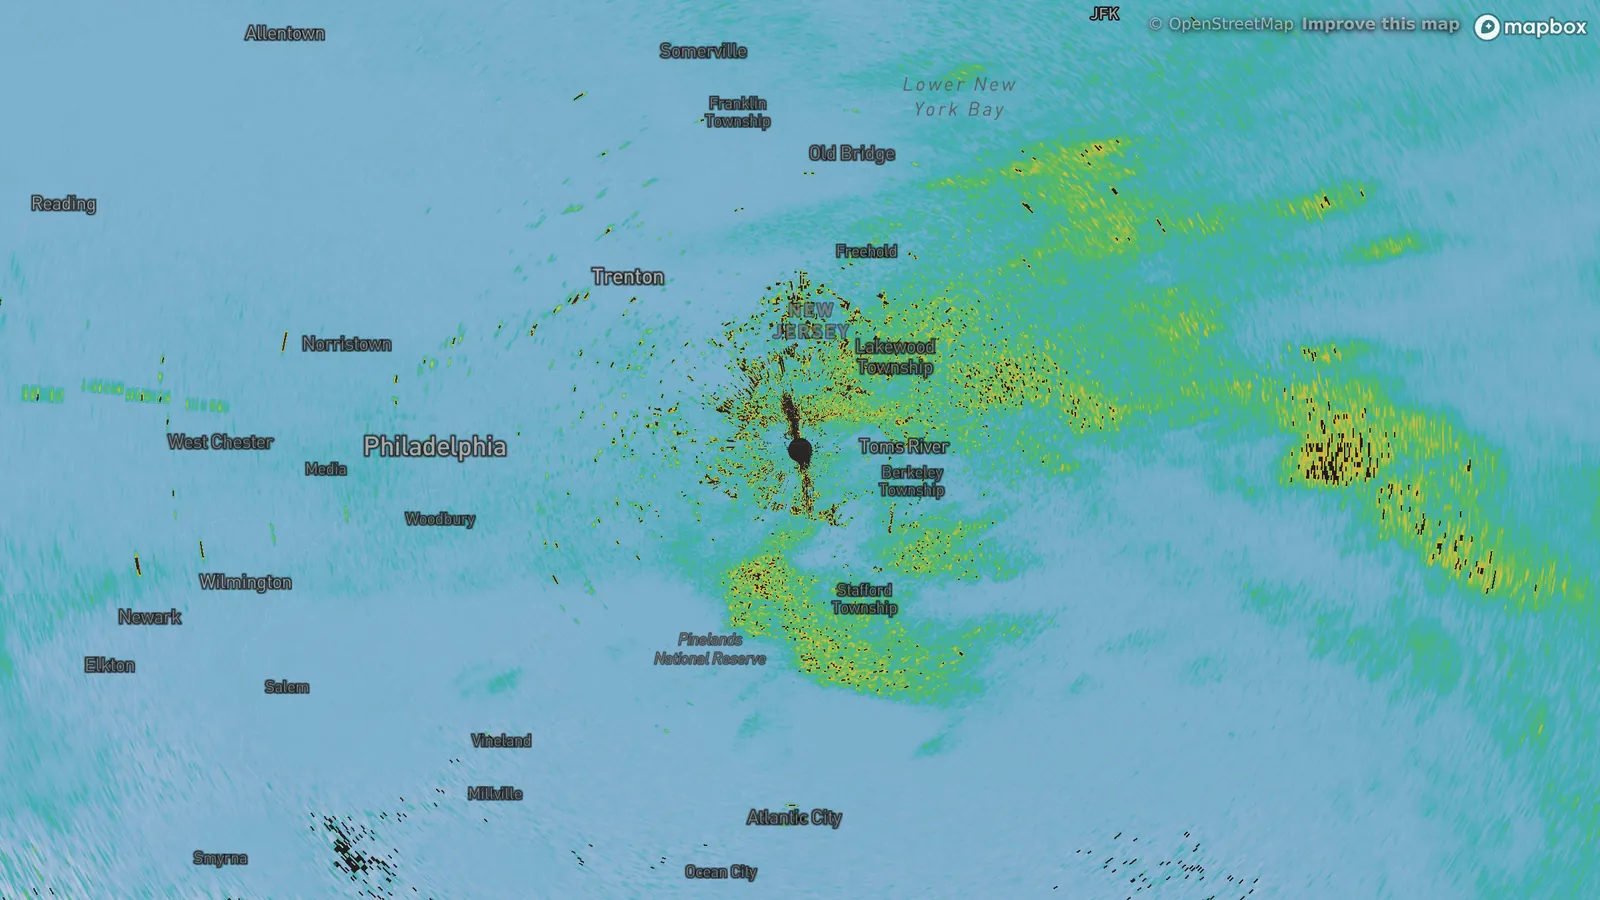
- KDIX Fort Dix, New Jersey
- 3:01 PM EST, November 15, 2018
- 0.4° tilt
- Correlation coefficient
- 1Lower values around the radar, where the beam crosses the melting layer.
- 2More of them to the east.
- 3Near 1 over Trenton and Philadelphia.
The beam is above the ground
The beam climbs as it travels. At its lowest tilt, 0.4°, it is about 930 feet above the radar at 30 km (19 miles) and 1,700 feet at 50 km (31 miles). The radar reports what is falling at that height, and the last stretch to the ground is out of view.
By 5:01 PM EST the same radar read 0.99 or higher across most of the picture. Philadelphia’s airport had rain at 33°F by then, Atlantic City had rain at 45°F, and Trenton was still reporting snow at 32°F. The National Weather Service says dual-polarization radar can find the melting layer but can’t give the exact type of precipitation at the ground.
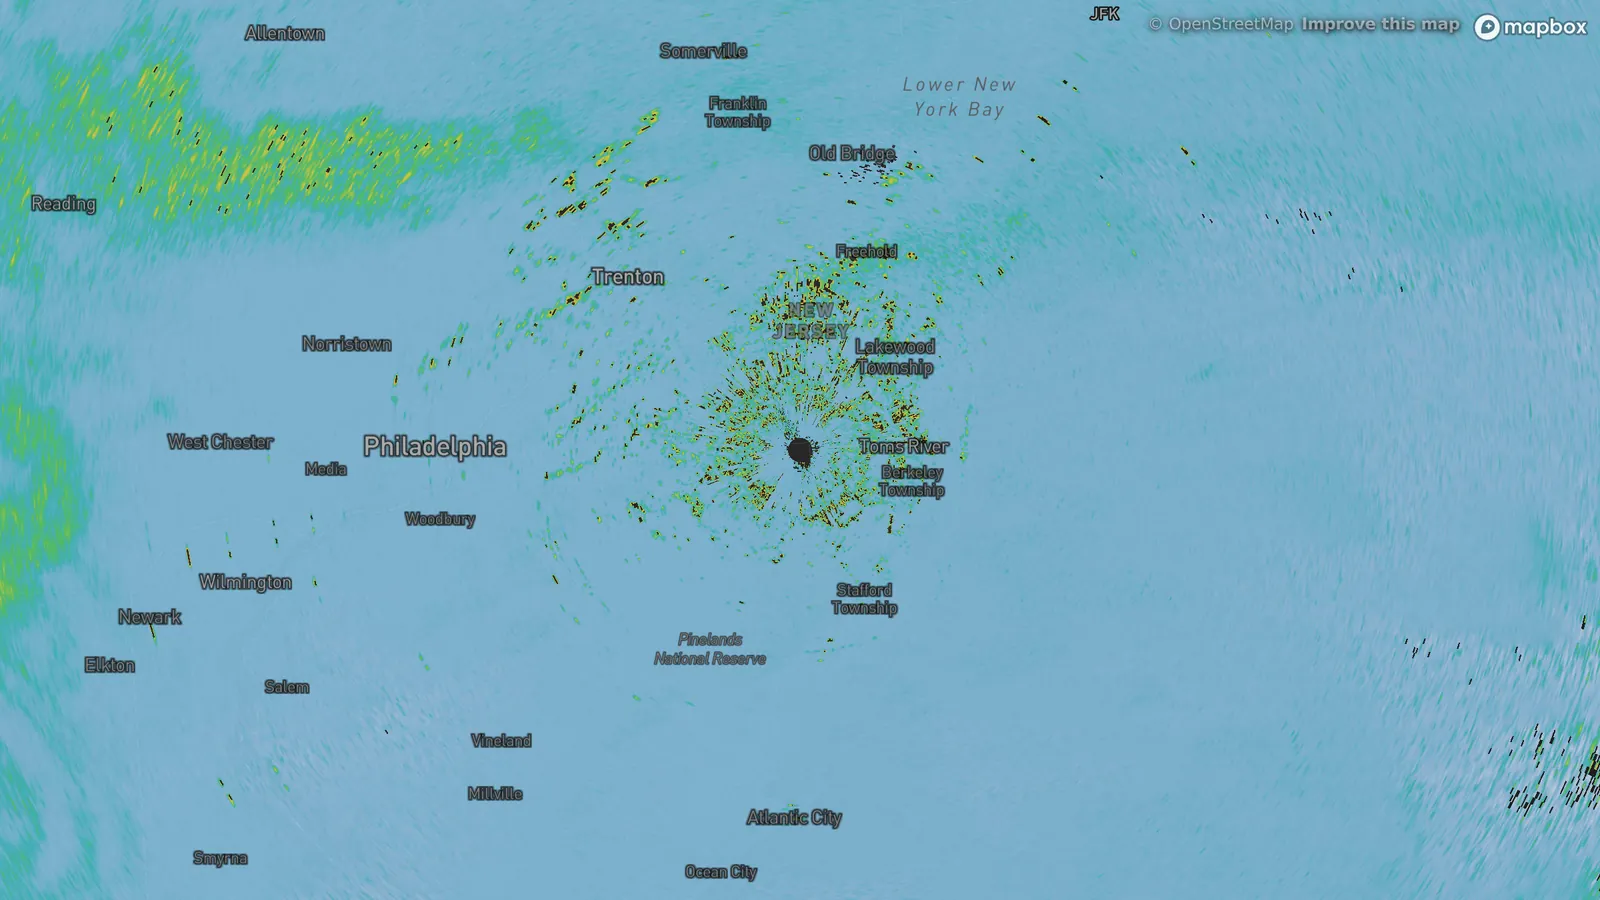
- KDIX Fort Dix, New Jersey
- 5:01 PM EST, November 15, 2018
- 0.4° tilt
- Correlation coefficient
- 1Trenton: snow, 32°F.
- 2Philadelphia airport: rain, 33°F.
- 3Atlantic City: rain, 45°F.
What to check
Start with the temperature at the ground. Within a degree or two of 32°F a storm can drop several kinds of precipitation in an afternoon: Philadelphia’s airport went from snow and sleet at 2:07 PM, to freezing drizzle at 4:26 PM, to rain at 4:42 PM, all between 31 and 33°F.
Then look for lower correlation coefficient. A ring or patch of it near you means snow is melting overhead, and a ring close to the radar means it is melting low. In Alerua, choose Product, then Correlation coefficient, on a radar that reports it, and compare it with Reflectivity at the same time.
Keep reading
- Dual-polarizationDual-polarization radar, explainedCorrelation coefficient, differential reflectivity and KDP, and how they tell rain from hail, debris, birds and insects.
- Forecast mapsHow to read a GFS snowfall mapWhat the totals add up, the 10-to-1 rule and why mountain totals are rough.
- Radar echoesWhy radar shows rain when it isn’t rainingRain that dries up before the ground, birds and insects, clutter and a picture a few minutes old.
Further reading
- National Weather Service Taunton: using dual-pol radar
- National Weather Service Albany: dual-polarization interpretation
- National Weather Service Amarillo: what dual-pol radar does
- American Meteorological Society glossary: bright band
- Iowa Environmental Mesonet: surface observations archive
Radar data from NOAA’s NEXRAD Level II archive. Surface reports from National Weather Service and FAA stations via the Iowa Environmental Mesonet. Base map © Mapbox © OpenStreetMap contributors.