 Alerua
3D radar
3D weather radar, explained
How a 3D view is built from the radar’s own scan, what it shows that a flat map can’t, and where it can mislead.
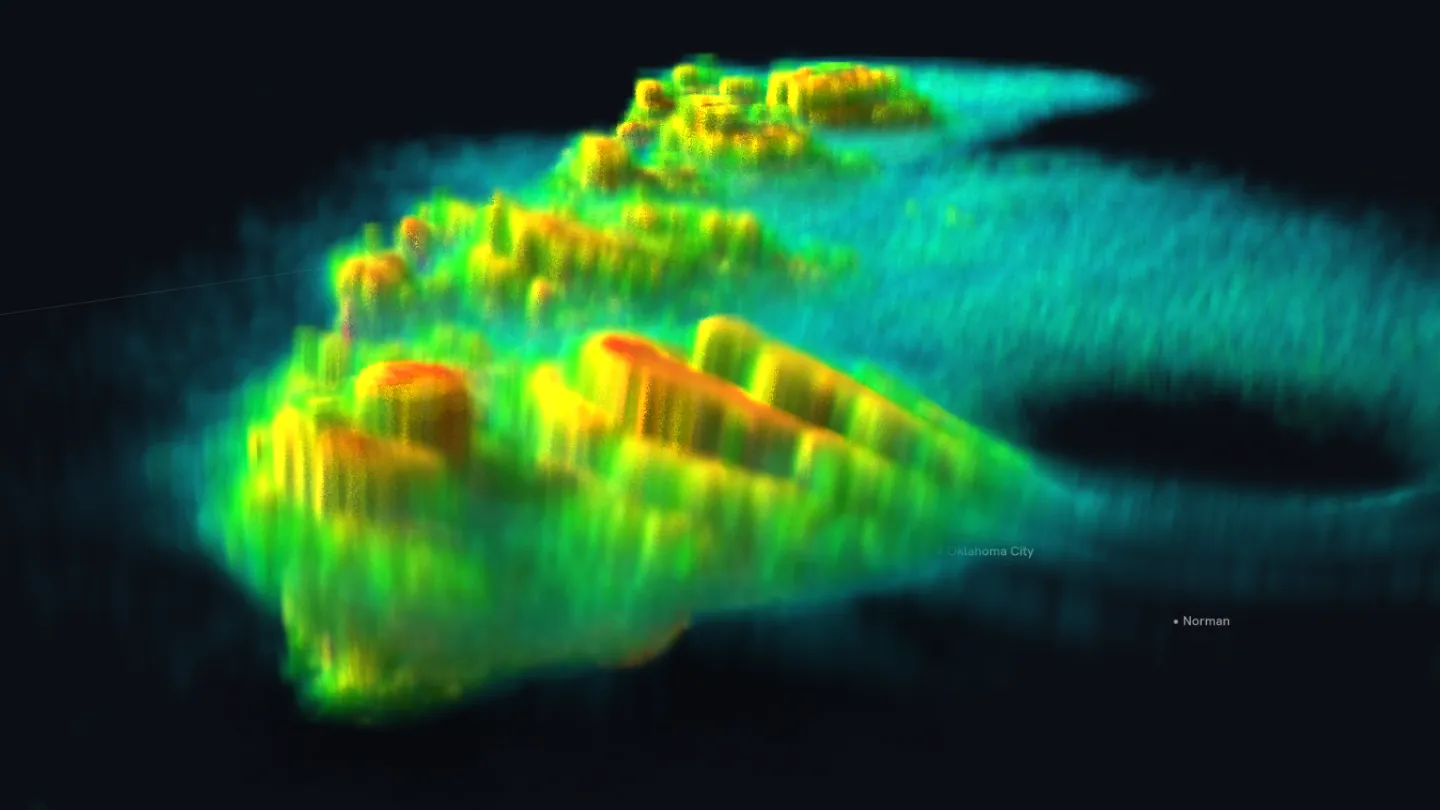
- KTLX Norman
- 6:14 PM CDT, May 31, 2013
- 3D · heights 1.65×
- 1The storm that produced the tornado: its core and top.
- 2A flat top, where one tilt ends.
- 3The hook, faint near the ground.
The radar already scans in 3D
A weather radar doesn’t take one picture. It turns a full circle with the dish raised just above the horizon, tips the dish up a step, turns again, and keeps going. In storm mode the US radars make 14 or 15 of these turns, from 0.5° up to about 20°, every four to five minutes. This scan had 14. Each turn is a tilt. The beam climbs as it travels, so each tilt cuts through a storm at a different height: at the El Reno storm, about 40 miles from the Norman radar, the lowest tilt passed about 2,600 feet above the radar and the highest more than 65,000.
A flat radar map draws one tilt, usually the lowest. A 3D view draws all 14 at once, each at the height where it was measured, so the storm stands up off the map. Every measurement in it comes from that one scan. In Alerua it is the 3D side of the Flat and 3D switch, in the iPhone and Mac apps.
What it shows that one tilt can’t
Echo from the storm that produced the El Reno tornado reached about 60,000 feet on this scan. Storms grow tall on strong updrafts, so the tower that stands above its neighbors is often the one with the strongest updraft.
In the same tower, reflectivity of 60 dBZ reached about 40,000 feet, and 55 dBZ nearly 50,000. That high it is far below freezing, so echo that strong is a powerful sign of hail held up by the updraft. The lowest tilt only samples the air near 2,600 feet, so it shows the hail only once it has fallen that far.
Which way a storm leans, where its core sits under the top and how it compares with the storms around it take time to piece together from one tilt after another. In 3D they are one picture.
Where a 3D view can mislead
The view fills the space between two tilts by blending them. At the El Reno storm’s distance the tilts sit about a quarter mile apart near the ground and 1½ to 2½ miles apart above 35,000 feet, and the beam is about two-thirds of a mile wide. Above about 30,000 feet, more of the picture is blended than measured.
A storm’s top in 3D is where one tilt saw echo and the next one up didn’t, so tops come out flat and stepped. The true top is somewhere in the gap.
The top of the picture is minutes newer than the bottom. This scan’s lowest tilt ended at 6:14 PM and its highest at 6:19. A storm moving 30 mph travels 2 miles in that time, so the top of the picture shows it a little farther along than the bottom.
Alerua draws heights 1.65 times taller than they are, because a storm 11 miles tall and many times as wide reads as a low band at true scale. Vertical scale in the 3D view’s settings switches to true scale, 1.5× or 2×.
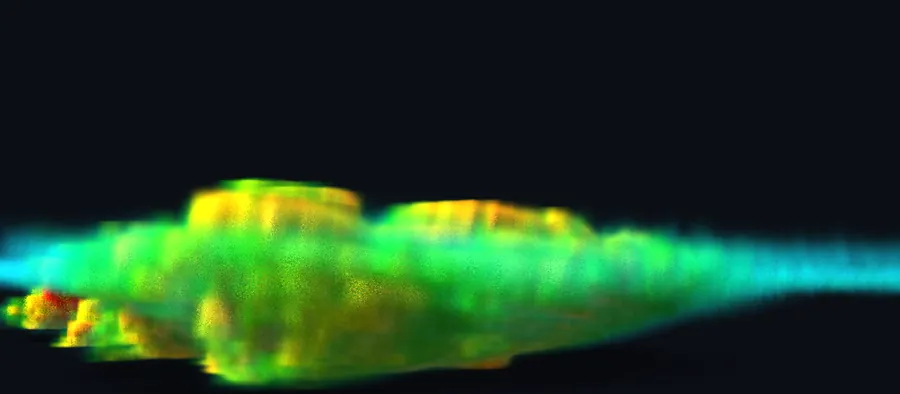
- True scale
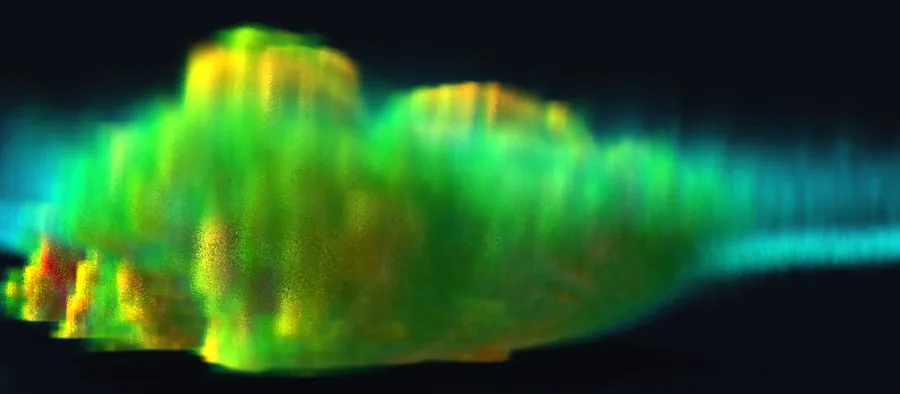
- 1.65×, the default
Echo under 15 dBZ is left out, and the lowest 10,000 feet fade toward the ground so the map shows through. The rain shafts are there, only faint, so low features such as the hook read better on the flat map.
The 3D view always drops echo with a correlation coefficient under 0.8, as the clutter filter does on the flat map. That clears most birds, insects and ground clutter, and it also removes tornado debris and can remove some real weather, such as large hail and mixed precipitation.
Nothing is measured in the cone above the radar, where even the highest tilt can’t look and which widens with height, or under the lowest beam far from it.
How forecasters read the same scan
Meteorologists have read storms in three dimensions for decades, by stepping through the tilts or slicing a cross-section through a storm. Leslie Lemon’s warning method, published in 1977 and taught today in updated form, looks for echo of about 50 dBZ or more above roughly 26,000 feet, strong echo in the middle of the storm, and a weak echo region beneath it, where air rises too fast for rain to fall out. This scan has all three. Just east of the hook the lowest tilt shows almost nothing, while 53 to 59 dBZ hangs 15,000 to 29,000 feet overhead. Read that one on the tilts: in 3D it sits too low to see well.
Forecasters also reduce the volume to one value per spot: echo tops, how high the echo reaches; VIL, an estimate of the water in the column, worked out from reflectivity; and composite reflectivity, the strongest echo at any height. All three are in Alerua’s Product menu. Each gives a number you can compare, and a 3D view gives the shape of the storm behind it.
Keep reading
- Using AleruaHow to use the Alerua radar mapEvery control on the radar page, from Product to Settings, and what the tilts see.
- Severe weatherHow to spot a tornado on radarThe hook echo, the rotation pair on velocity and the debris signature.
- Radar basicsHow to read weather radarWhat a radar measures, what the colors mean and how to read a loop.
Further reading
- NOAA JetStream: volume coverage patterns
- College of DuPage: the Lemon technique
- NEXRAD Level II data on the Registry of Open Data on AWS
Radar data from NOAA’s NEXRAD Level II archive. Base map © Mapbox © OpenStreetMap contributors.