 Alerua
Forecasts
Why weather forecasts are often wrong
Why the same hour is forecast differently from one run to the next, and what a rain chance means.
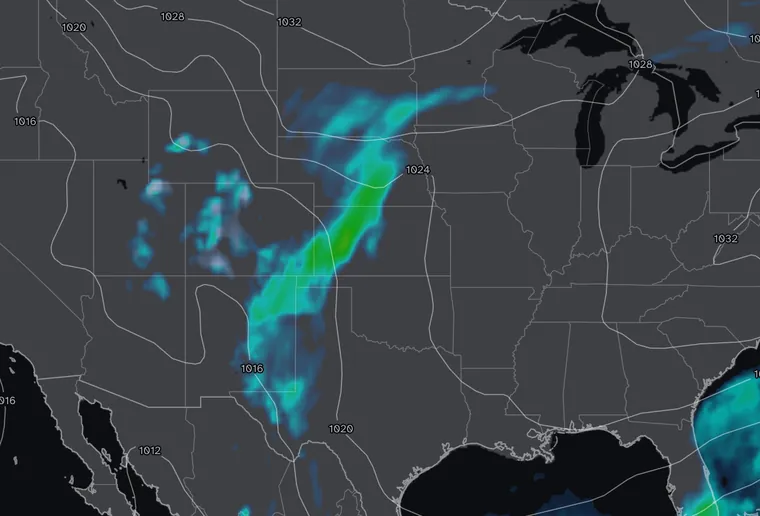
- Made Fri 8 AM EDT
- 60 hours ahead
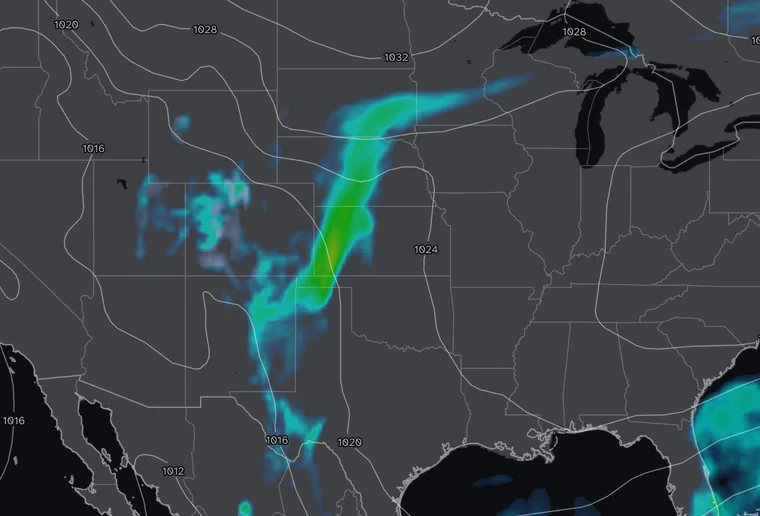
- Made Fri 8 PM EDT
- 48 hours ahead
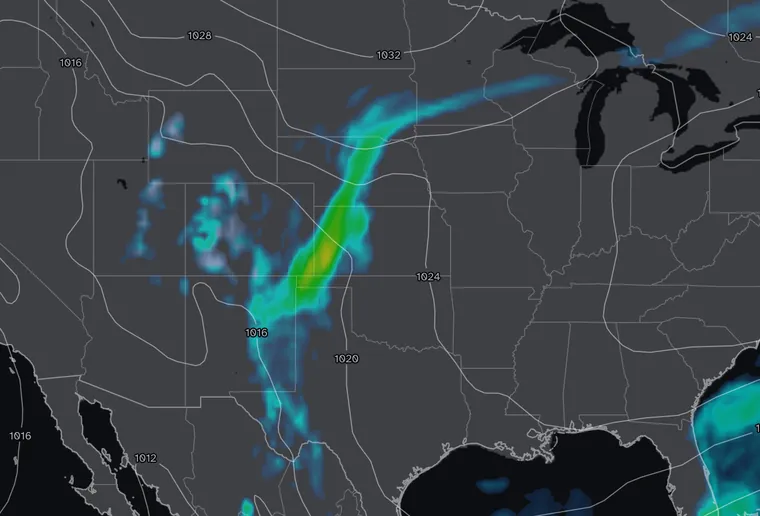
- Made Sat 8 AM EDT
- 36 hours ahead
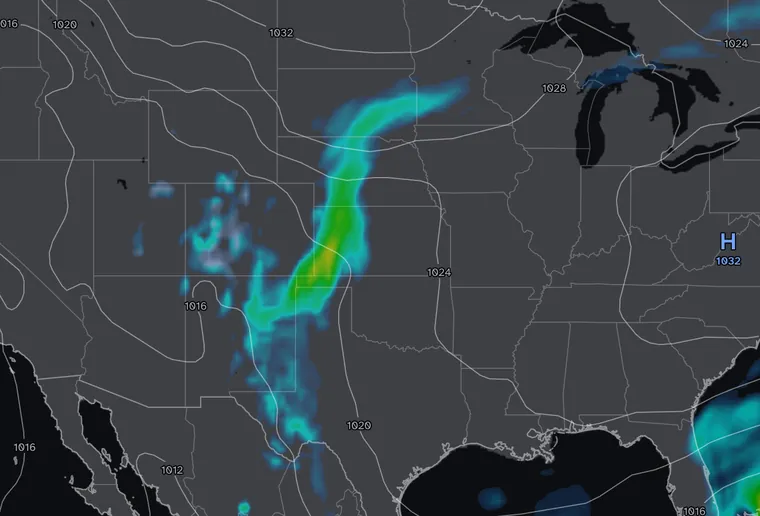
- Made Sat 8 PM EDT
- 24 hours ahead
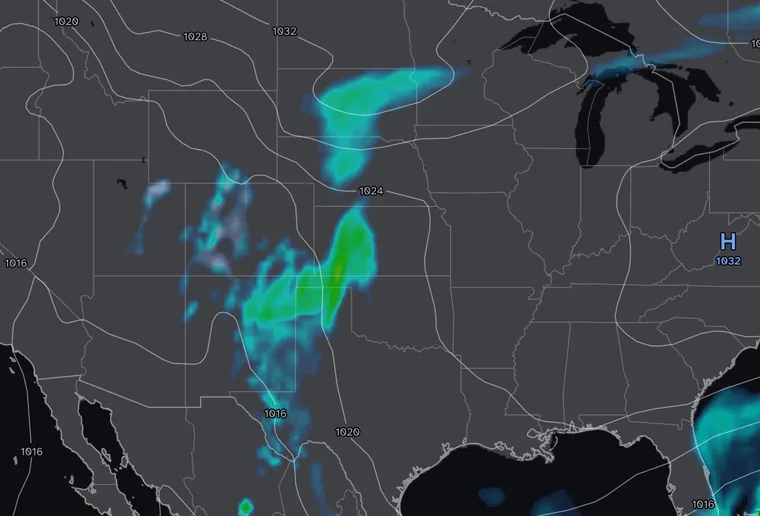
- Made Sun 8 AM EDT
- 12 hours ahead
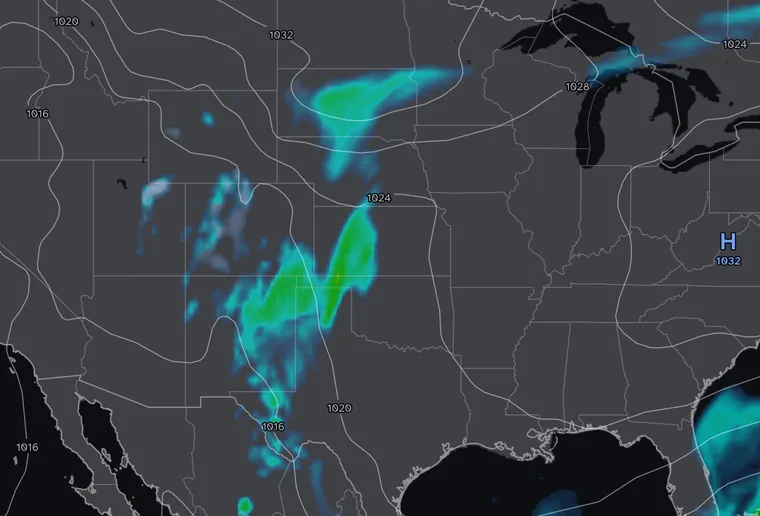
- Made Sun 2 PM EDT
- 6 hours ahead
The same hour, forecast six times
Each map is a GFS precipitation map for the same moment, 8 PM Eastern on October 25, 2026. The first was made 60 hours earlier and the last six. A rain band crosses the Plains in all of them. Its strength and shape change from run to run, and in the last two it breaks into a northern and a southern piece. Each map was the model’s best answer from what it knew when it ran, and the model runs again every six hours. That is why a forecast changes between morning and evening.
Small errors grow
A weather model starts from measurements: stations, weather balloons, aircraft, satellites and radar. They leave gaps, over the oceans and in the air high above the ground, and every measurement is a little off. The atmosphere is chaotic, so a small error at the start grows as the model steps forward in time. NOAA’s education pages put a five-day forecast right about 90% of the time, a seven-day forecast about 80% of the time, and anything past ten days about half.
A model can’t draw a thunderstorm
The GFS computes the atmosphere on a grid about 8 miles apart, and its maps usually come on a coarser grid a quarter of a degree apart, about 17 miles. A thunderstorm is a few miles across, too small for that grid to draw. The model estimates the combined effect of the storms in each grid square instead. Finer models with points about two miles apart can draw single storms, but they still get their exact time and place wrong, and they look only a day or two ahead.
The grid also smooths over mountains, lakes, coastlines and cities, which is why a forecast can be right for the region and wrong for your valley.
Timing and place are the usual misses
A forecast often gets the front right and misses its timing by three hours or its position by thirty miles. A front that arrives three hours late turns “rain at 5 PM” into a dry drive home, and a band that sets up 30 miles east rains on the next town.
What a rain chance means
A 30% chance of rain is the chance that your forecast point gets at least 0.01 inch of rain. On ten days with the same conditions, it rains at your spot on about three of them. If it stays dry, the forecast was not wrong; on seven days in ten, that is what it said.
Two apps can also give different answers at the same moment, because they use different models or blends. The GFS updates every six hours, and other models on their own schedules.
When the forecast and the sky disagree
A forecast says what may happen. A radar loop shows what is falling now and which way it is moving, which makes it the better guide for the next hour. In Alerua the GFS maps are under Models and the live radar is under Radar.
Keep reading
- Forecast mapsHow to read a GFS precipitation mapThe rain, snow and sleet colors, the six-hour average rate, the pressure lines and the 540 line.
- Forecast mapsHow to read a GFS temperature mapThe color scale, the dashed 32°F line, and how night, day and mountains change the map.
- HurricanesHow to read a hurricane forecast mapThe cone, the colored model lines, and what the strength colors and categories mean.
Further reading
- NOAA: how reliable are weather forecasts?
- NWS Peachtree City: probability of precipitation
- NOAA: the Global Forecast System
Forecast maps from NOAA’s GFS model. Base map © Mapbox © OpenStreetMap contributors.