 Alerua
Forecast maps
How to read a GFS temperature map
What the colors and the dashed 32°F line show, and how night, day and mountains change them.
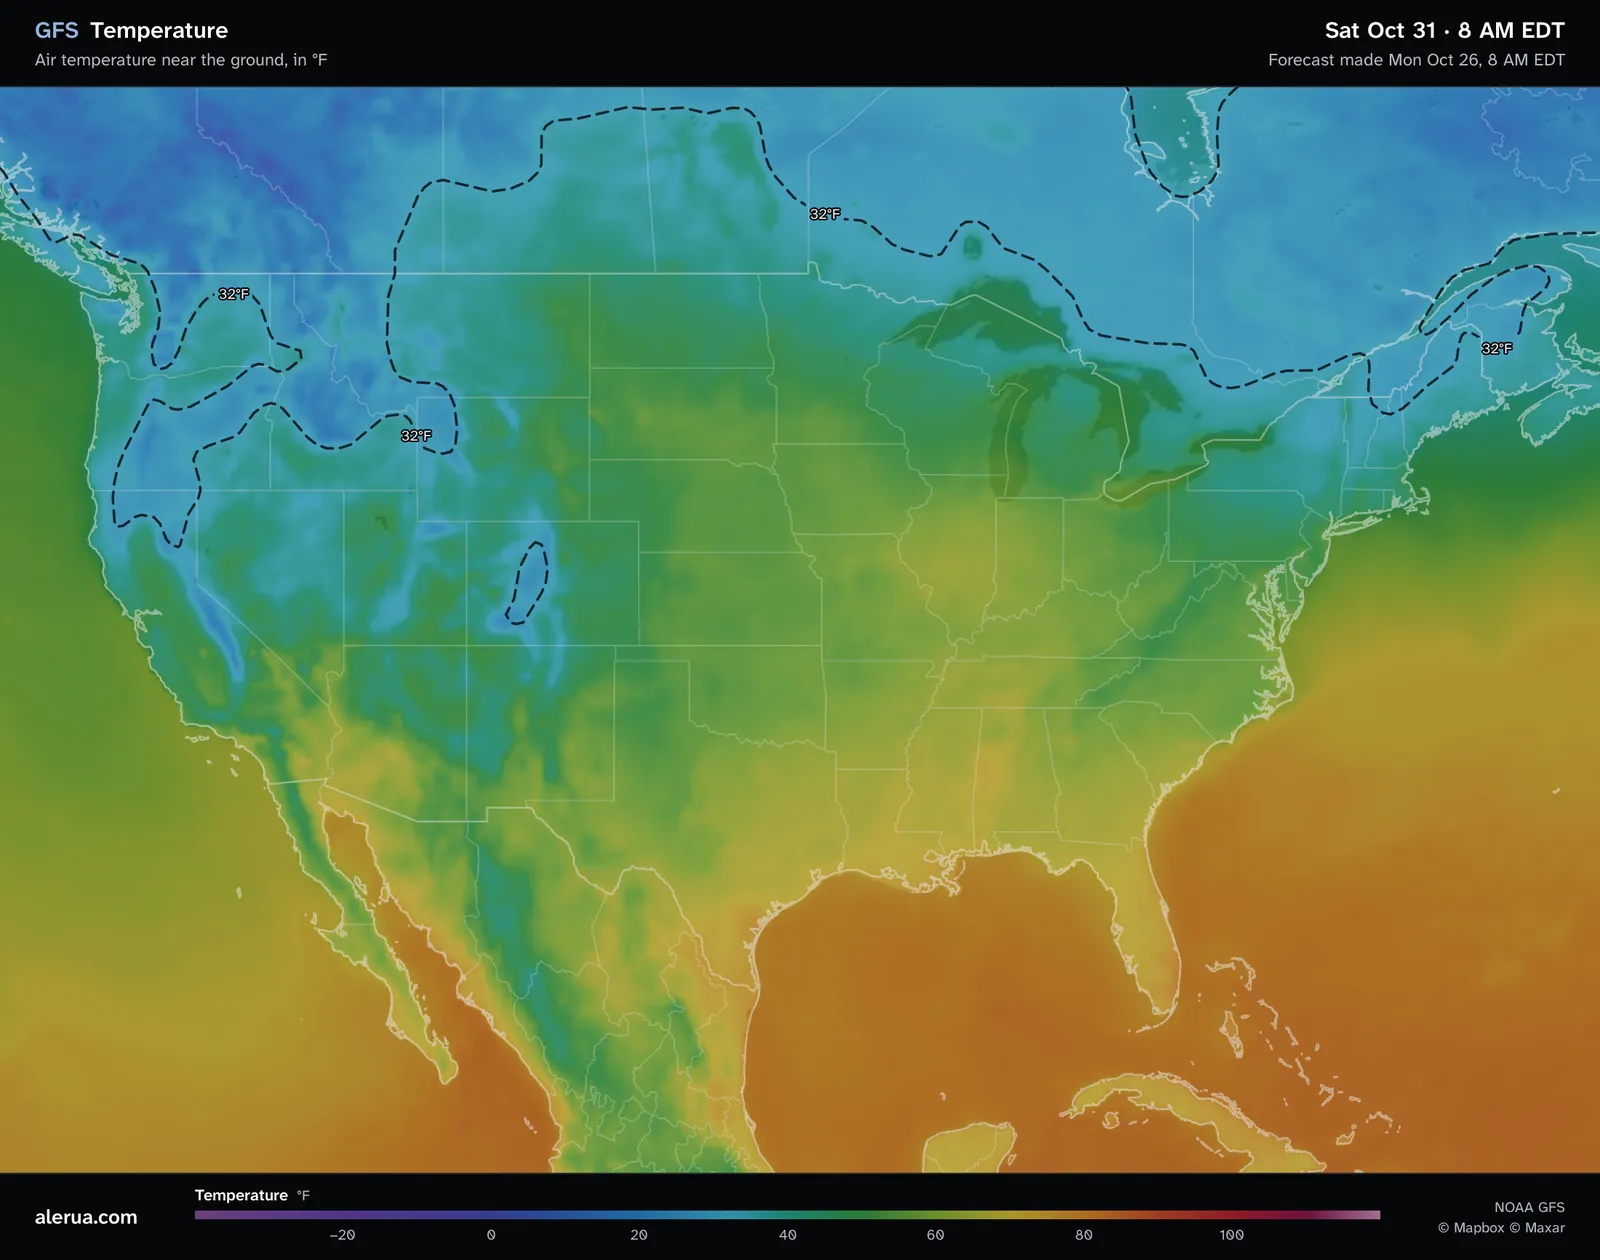
- 1A pocket below freezing in the Colorado Rockies.
- 2Denver.
- 3The 32°F line across the north.
What the colors show
The map shows the forecast air temperature 2 meters (6.6 feet) above the ground, about where a weather station reads it. Over the ocean it is the temperature of the air, and the water under it can differ. The scale runs from purple at −40°F and blue at 0°F to cyan at 32°F, green near 50°F, yellow at 70°F, orange at 80°F and red from 100°F.
Each map is a single moment, the time at the top of the picture. A day’s high is the warmest of its maps, usually the one near 2 PM, and its low is the coolest, usually the one near 8 AM.
The 32°F line
The dashed line follows 32°F, where water freezes. The air on the cold side of it is below freezing. A closed loop marks a patch of cold air, and the loop over Colorado on this map is one in the high country.
Frost can form while the air is a little above 32°F. The National Weather Service explains that thermometers are read 4 to 5 feet up, and on a calm, clear night the air at the surface can be up to 10 degrees colder. A reading of 33 to 36°F can come with frost.
Where rain turns to snow depends on the air above the ground as well, which is what the 540 line is for.
Mountains
At 8 AM Eastern on Saturday, October 31, which is 6 AM in Colorado, the model has 26°F at Leadville, about 10,000 feet up, and 53°F at Denver, about 75 miles away and nearly a mile lower. The 32°F line closes around the high country between them. Height is the main reason. The model sees the mountains through a grid with points about 28 km (17 miles) apart, which smooths them, so a narrow valley or a single peak is missing from the map and a mountain town can run colder or warmer than its grid point.
Night and day
Six hours later, at 2 PM Eastern, Leadville is at 39°F and Denver at 62°F. The Colorado pocket is gone and the 32°F lines have moved north. In Madison, Wisconsin the model goes from 51°F at 8 AM to 59°F at 2 PM.
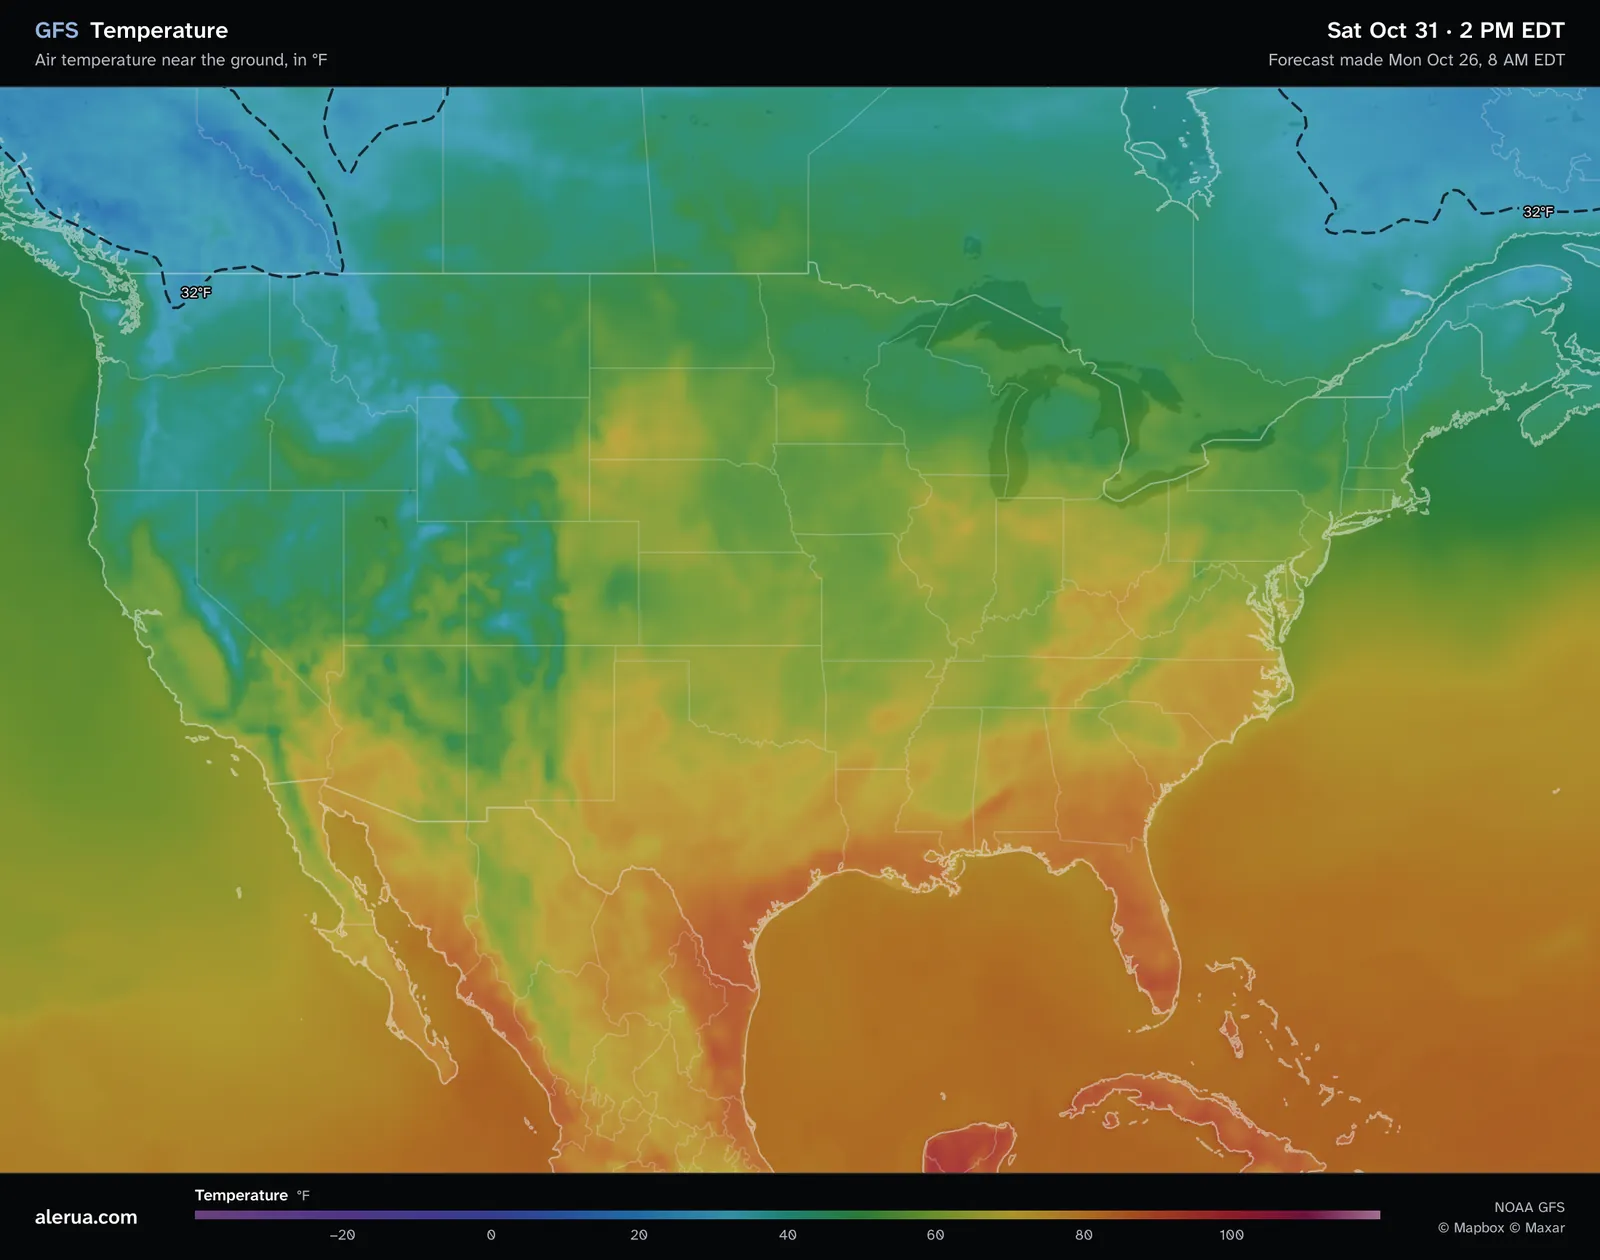
- 1The Colorado pocket has gone.
- 2The 32°F line has moved north.
The map shows air temperature only. Wind chill and heat index, which describe how the air feels, are not on it.
Keep reading
- Forecast mapsHow to read a GFS snowfall mapWhat the totals add up, the 10-to-1 rule and why mountain totals are rough.
- Forecast mapsHow to read a 500 mb mapThe height lines, troughs and ridges, and the shaded vorticity.
- ForecastsWhy weather forecasts are often wrongWhy the same hour is forecast differently from one run to the next, and what a rain chance means.
Further reading
- National Weather Service La Crosse: why frost forms above freezing
- NOAA JetStream: constant pressure charts, thickness
- NOAA: the Global Forecast System
Forecast maps from NOAA’s GFS model. Base map © Mapbox © OpenStreetMap contributors © Maxar.