 Alerua
Hurricanes
How to read a hurricane forecast map
What the cone covers, what the colored model lines are, and what a category tells you.
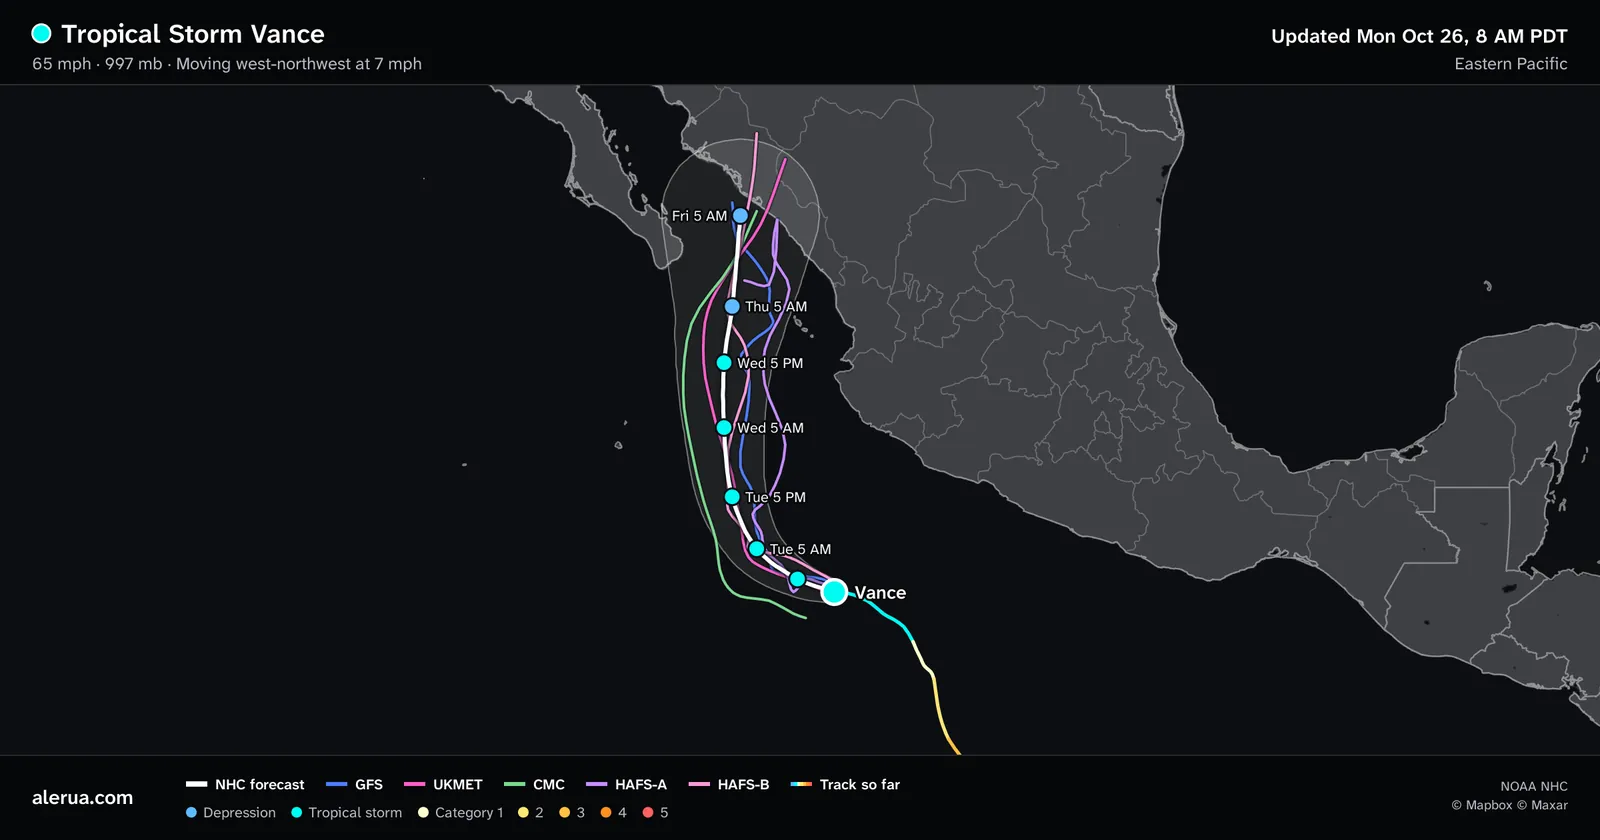
- 1The storm now, a tropical storm with 65 mph wind.
- 2The cone.
- 3The National Hurricane Center forecast, with a dot at each forecast time.
- 4Computer models, one line each.
- 5The track so far, colored by strength.
The cone
The National Hurricane Center (NHC) forecasts where the center of a storm will be at 12, 24, 36, 48, 60, 72, 96 and 120 hours. The cone is the area swept by circles drawn around those positions. Each circle is sized so that, over the past five years, about two-thirds of the center’s forecast errors fell inside it. The 2026 sizes use the errors from 2021 to 2025. So the center stays inside the cone about two times in three, and leaves it about one time in three.
The cone widens because forecasts get worse with time. In the Atlantic the circle has a radius of 25 nautical miles (29 miles) at 12 hours and 200 (230 miles) at 120 hours, which makes a five-day cone about 460 miles across. In the Eastern and Central Pacific the radius grows from 25 to 138 nautical miles (159 miles).
The cone is the probable path of the center and nothing else. It shows no wind, rain or storm surge, which reach well beyond it, and nothing about how large or strong the storm is. A town outside the cone can still get damaging wind and flooding rain.
The white line and the dots
The white line is the center of the NHC’s own forecast. Each dot is a forecast position, labeled with its day and time, every 12 hours for three days and then every 24, and colored by the strength forecast there. On this map Vance is forecast to weaken from a tropical storm, in cyan, to a depression, in blue, by Thursday morning.
The model lines
Each thin colored line is one computer model’s forecast of the center’s path: the GFS from NOAA, the UKMET from the U.K. Met Office, the CMC from Canada, and two versions of HAFS, NOAA’s hurricane model. The models solve the physical equations for the atmosphere on a grid. The global ones have points 10 to 15 km apart, and HAFS adds nests of about 2 km around the storm.
The NHC weighs all of them when it draws its line, and says its forecasts have smaller errors on average than any single model. It advises following the official forecast and your local National Weather Service office, not model output alone.
On this map the lines agree for the first day and then fan out. The CMC, in green, runs west along the edge of the cone, and HAFS-A, in purple, runs east. Where the lines bunch, the models agree, and where they spread, they do not, which is what the width of the cone says too. One line that goes its own way is not a forecast of what will happen. In Alerua’s key under the map, tap a model’s name to hide its line.
The colors and the categories
The track so far is colored by the storm’s strength at each point, and so is each dot on the forecast. A hurricane’s category comes from one number, its maximum sustained wind, on the Saffir-Simpson scale. Categories 3, 4 and 5 are major hurricanes.
| Color and name | Maximum sustained wind |
|---|---|
| Depression | Under 39 mph |
| Tropical storm | 39 to 73 mph |
| Category 1 | 74 to 95 mph |
| Category 2 | 96 to 110 mph |
| Category 3 (major) | 111 to 129 mph |
| Category 4 (major) | 130 to 156 mph |
| Category 5 (major) | 157 mph or more |
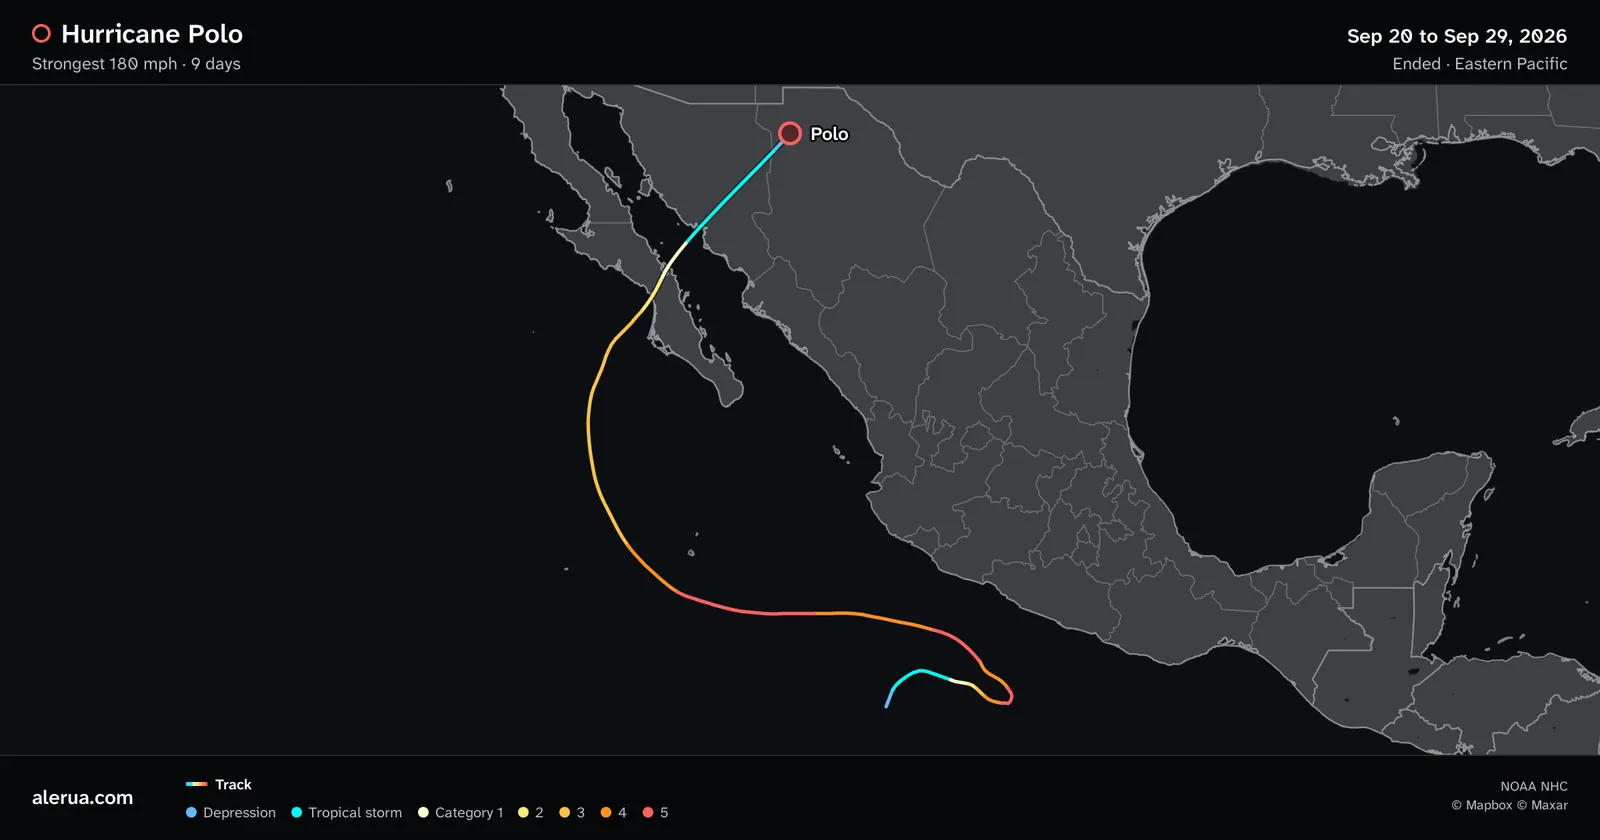
- 1A depression, then a tropical storm, in blue and cyan.
- 2The strongest stretch, in orange and red.
- 3Weakening over northern Mexico.
Hurricane Polo started as a depression, reached 180 mph, which is Category 5, and weakened on its way to northern Mexico. Its track shows all of it. The scale measures wind only. The NHC says it does not account for storm surge, flooding rain or tornadoes, and a hurricane of any category can produce them.
Where the map comes from
A map is a picture of the NHC’s latest advisory, which has the full text, the wind sizes and the watches and warnings for each coast. Each storm page on Alerua’s hurricane tracker links to its advisory. When a warning is out, follow your local officials’ evacuation orders.
Keep reading
- ForecastsWhy weather forecasts are often wrongWhy the same hour is forecast differently from one run to the next, and what a rain chance means.
- Forecast mapsHow to read a 500 mb mapThe height lines, troughs and ridges, and the shaded vorticity.
- Weather alertsWatch vs warning: what each one meansWhat a watch and a warning say for tornadoes, severe storms and floods, and how they look on a radar map.
Further reading
- NOAA National Hurricane Center: about the cone
- NOAA National Hurricane Center: the Saffir-Simpson wind scale
- NOAA National Hurricane Center: forecast model summary
Storm data from NOAA’s National Hurricane Center. Base map © Mapbox © Maxar.