 Alerua
Forecast maps
How to read a GFS precipitation map
What the colors, the six-hour average rate and the pressure lines mean, and why the 540 line is only a rough guide to rain or snow.
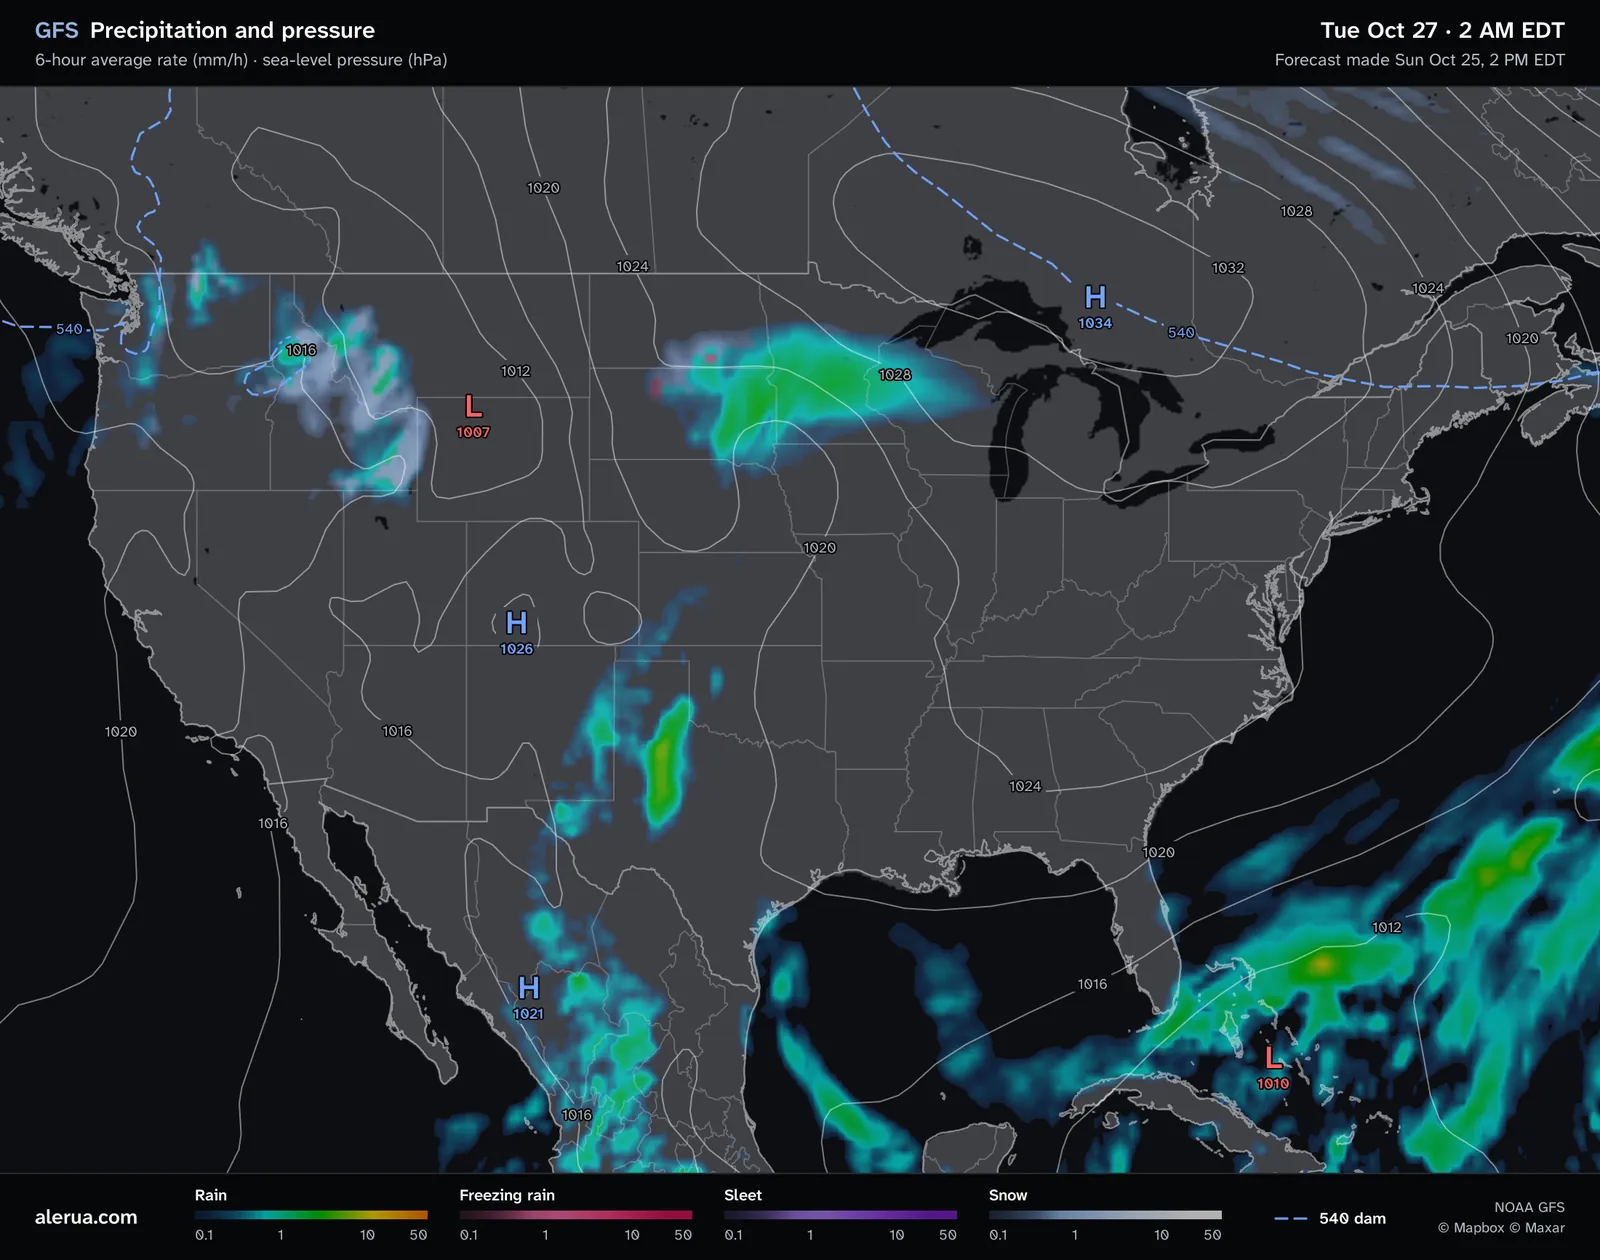
- 1Rain, green where it falls at a few millimeters an hour.
- 2Snow, in gray and white.
- 3A low, 1007 hPa at its center.
- 4A high, 1034 hPa.
- 5A pressure line, 1024 hPa along it.
- 6The 540 line, dashed.
The colors
The model decides what kind of precipitation falls at each point: rain, freezing rain, sleet (ice pellets) or snow. Each kind has its own color bar in the legend, and the color tells how hard it falls, from 0.1 to 50 millimeters an hour, with each tick ten times the one before it. Alerua shades each point by the model’s own type, not by a rule of ours.
Rain of up to about 2.5 mm an hour (0.10 inch) counts as light, up to about 7.6 mm (0.30 inch) as moderate, and anything above that as heavy, by the American Meteorological Society’s definitions. Green on the map is a few millimeters an hour, and yellow and orange are heavy. Snow is shown as melted water. At the usual 10 to 1 ratio, 1 mm of water an hour is about 1 cm (0.4 inch) of snow an hour.

What “6-hour average rate” means
Each point shows the average rate over the six hours ending at the time on the map. Multiply it by six for that window’s total depth: 2 mm an hour is about 12 mm, half an inch, over the six hours. The model runs four times a day, and maps come every six hours out to 16 days.
An average smooths a downpour out. A storm that drops 12 mm in one hour and then stops shows as 2 mm an hour for the whole window, so showers look broader and weaker than they do on radar. A map says where rain is likely over six hours, and radar says what is falling now.
The pressure lines
The white lines connect places with the same sea-level pressure, one every 4 hPa, with the value written along them. Pressure is adjusted to sea level so that a mountain town and a beach compare fairly. A red L marks the middle of a low and a blue H the middle of a high, with the pressure at that point. Air rises around a low, which brings clouds and precipitation, and sinks around a high, which clears the sky. On this map the 1007 hPa low over Montana has snow to its west, and the 1034 hPa high over Ontario has none.
Lines packed close together mean a steep change in pressure and strong wind. Lines far apart mean light wind. In the Northern Hemisphere wind turns counterclockwise around a low and clockwise around a high.
The 540 line
The dashed blue line is the 540 dam thickness, and the footer of the map labels it. Thickness is the distance between two pressure levels in the air, here 1000 and 500 hPa, in decameters (1 dam is 10 m), so 540 dam is 5,400 m. Warm air expands, so a thin layer is cold and a thick one is warm. The traditional rule is that precipitation on the cold side of the 540 line falls as snow and on the warm side as rain. NOAA calls it a good first guess and adds that there are always exceptions, especially with seasons and terrain.
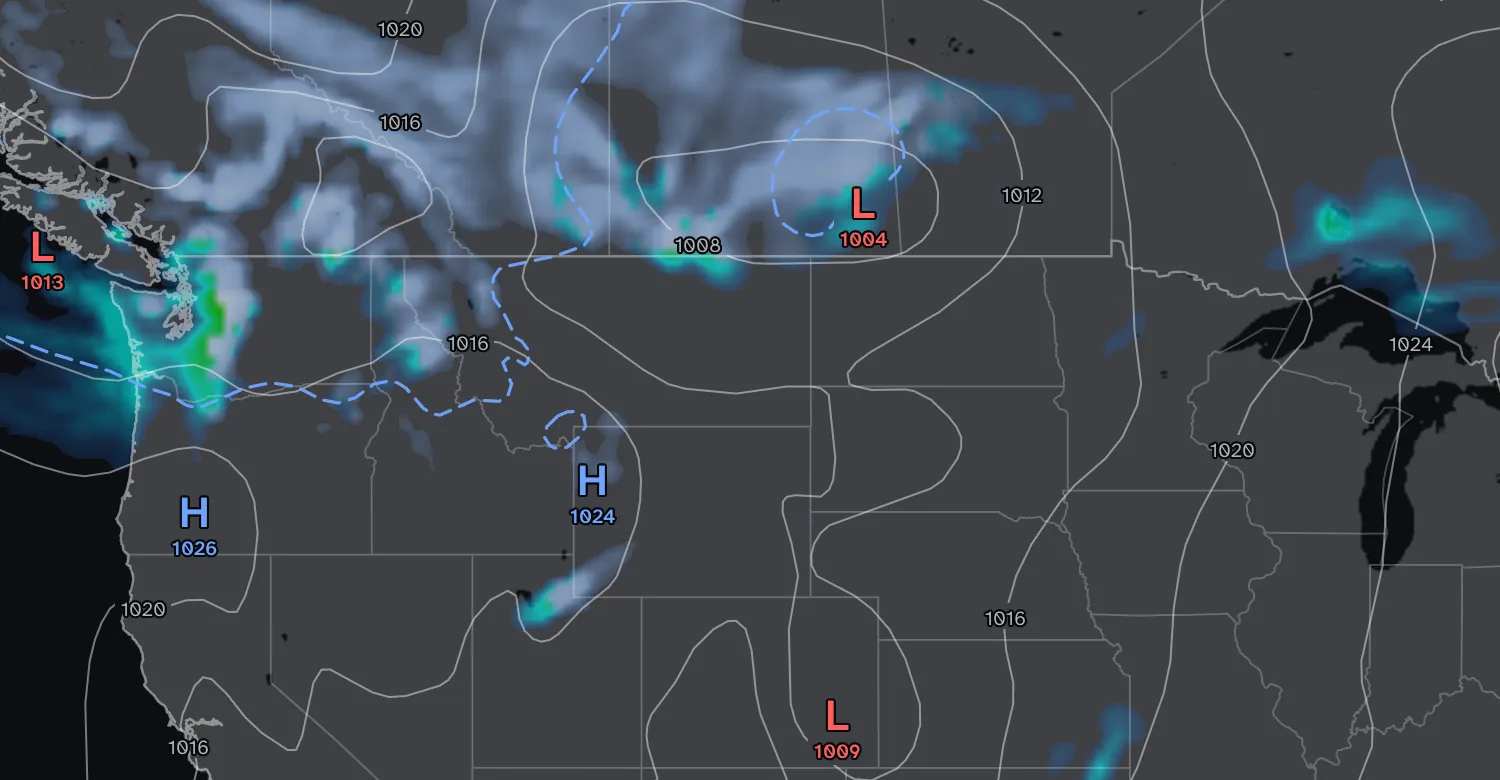
- Wed Oct 28 · 2 AM EDT
- Made Sun Oct 25 · 2 PM EDT
- 1The 540 line.
- 2Snow, on the cold side of it.
- 3Rain, along the coast, also on the cold side.
On this map most of the snow lies on the cold side of the line. The coast is the exception: rain falls there on the cold side too. The critical thickness is lower where the air comes off the ocean, and it climbs with height above sea level, from 543 dam at Salt Lake City’s airport to 576 dam on Mount Timpanogos, according to the National Weather Service’s Weather Prediction Center. A layer of warm air near the ground, too thin for thickness to show, melts snow or freezes rain. Forecasters use thicknesses of thinner layers, and a model sounding of temperature at every height does best.
Use the shading for the type of precipitation and the line for context. Where the type matters, such as a freezing rain forecast, look at the model’s own freezing rain and sleet colors.
Keep reading
- Forecast mapsHow to read a GFS snowfall mapWhat the totals add up, the 10-to-1 rule and why mountain totals are rough.
- Forecast mapsHow to read a GFS temperature mapThe color scale, the dashed 32°F line, and how night, day and mountains change the map.
- Forecast mapsHow to read a 500 mb mapThe height lines, troughs and ridges, and the shaded vorticity.
Further reading
- NOAA JetStream: constant pressure charts, thickness
- NWS Weather Prediction Center: snow forecasting
- American Meteorological Society glossary: rain
- NOAA: the Global Forecast System
Forecast maps from NOAA’s GFS model. Base map © Mapbox © OpenStreetMap contributors © Maxar.