 Alerua
Forecast maps
How to read a GFS snowfall map
What the totals add up, how the 10-to-1 rule turns water into inches of snow, and where it goes wrong.
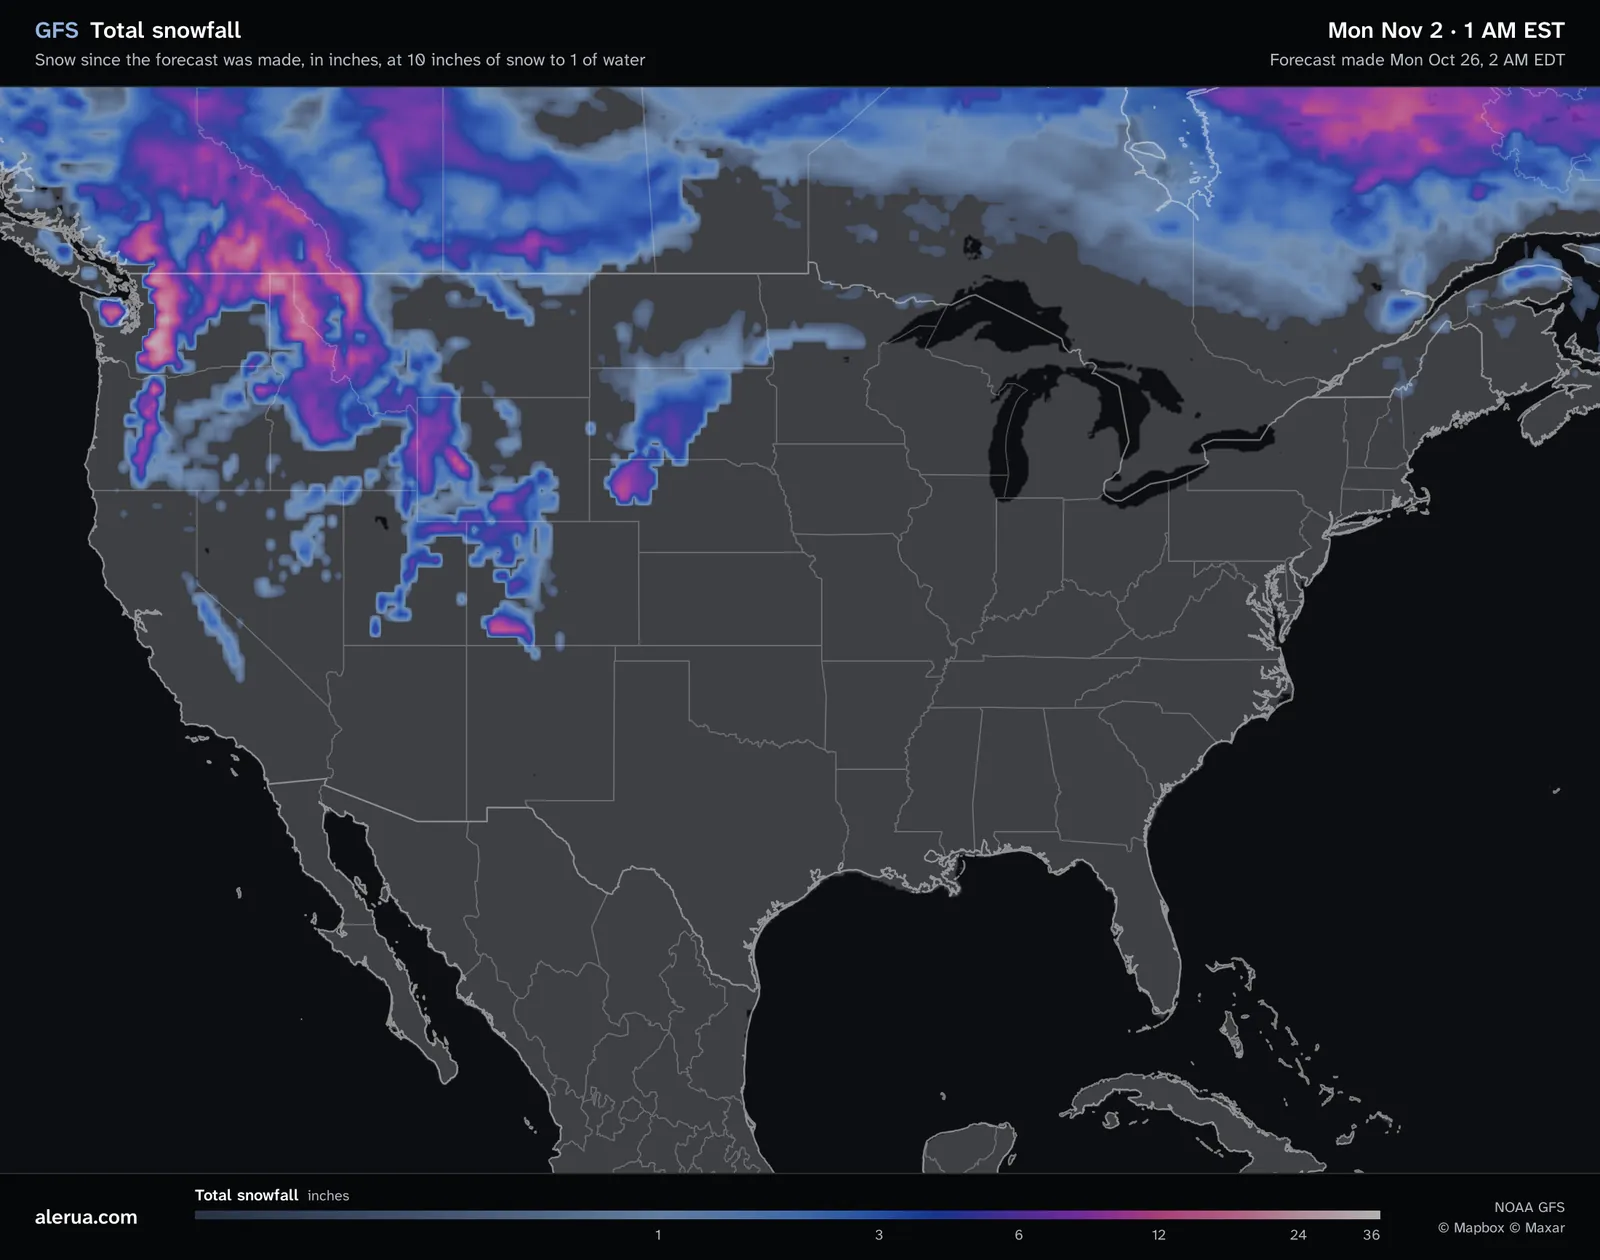
- 1Heavy snow over the Cascades and the northern Rockies, in pink.
- 2Snow in the mountains of Utah and Colorado.
- 3A small area of snow in northeastern Wyoming.
- 4No snow in the forecast.
What the totals add up
The map shows all the snow forecast between the time the model ran and the time at the top of the picture, in inches. This one was made on Monday, October 26 at 2 AM EDT and shows Monday, November 2 at 1 AM EST, so it holds a week of snow. At a later hour the totals can only grow.
The model forecasts a precipitation rate averaged over each six hours, and the type of precipitation. Alerua multiplies each rate by six to get the water in that window, keeps the windows whose main type is snow and adds them up. Rain, freezing rain and sleet add nothing. The legend runs from dark blue under an inch, through blue and purple at 3 to 6 inches, to pink at 12 and gray-white at 24 to 36. A window counts as snow when snow is its main type, so one that starts as rain and ends as snow counts either whole or not at all.
The 10-to-1 rule
The model forecasts water. To get inches of snow, the map assumes 10 inches of snow for every inch of water. Mount Washington Observatory calls 10 to 1 the commonly cited ratio and says that using it without regard to temperature, wind and the shape of the snow crystals can lead to large errors in snowfall forecasts.
The real ratio runs from 1.9 to 1 up to 100 to 1 in extreme cases. Snow that forms in colder air is drier and fluffier, so the same water makes more inches. Snow near freezing is wetter and heavier and makes fewer. One inch of water is 5 inches of snow at 5 to 1, 10 inches at 10 to 1 and 20 inches at 20 to 1. A map fixed at 10 to 1 runs low in a very cold storm and high in a wet one, and nothing on it says which.
The same hour as total precipitation
The total precipitation map adds up all the water, rain and melted snow, from 0.1 to 10 inches. It comes before the 10-to-1 rule and before the sorting by type. Where the snow map shows heavy snow over the northern Rockies and the Cascades, the water map shows an inch or two, and the snow in inches is roughly ten times that. The heaviest water totals on land, in the Southeast, have no snow beside them because that water falls as rain.
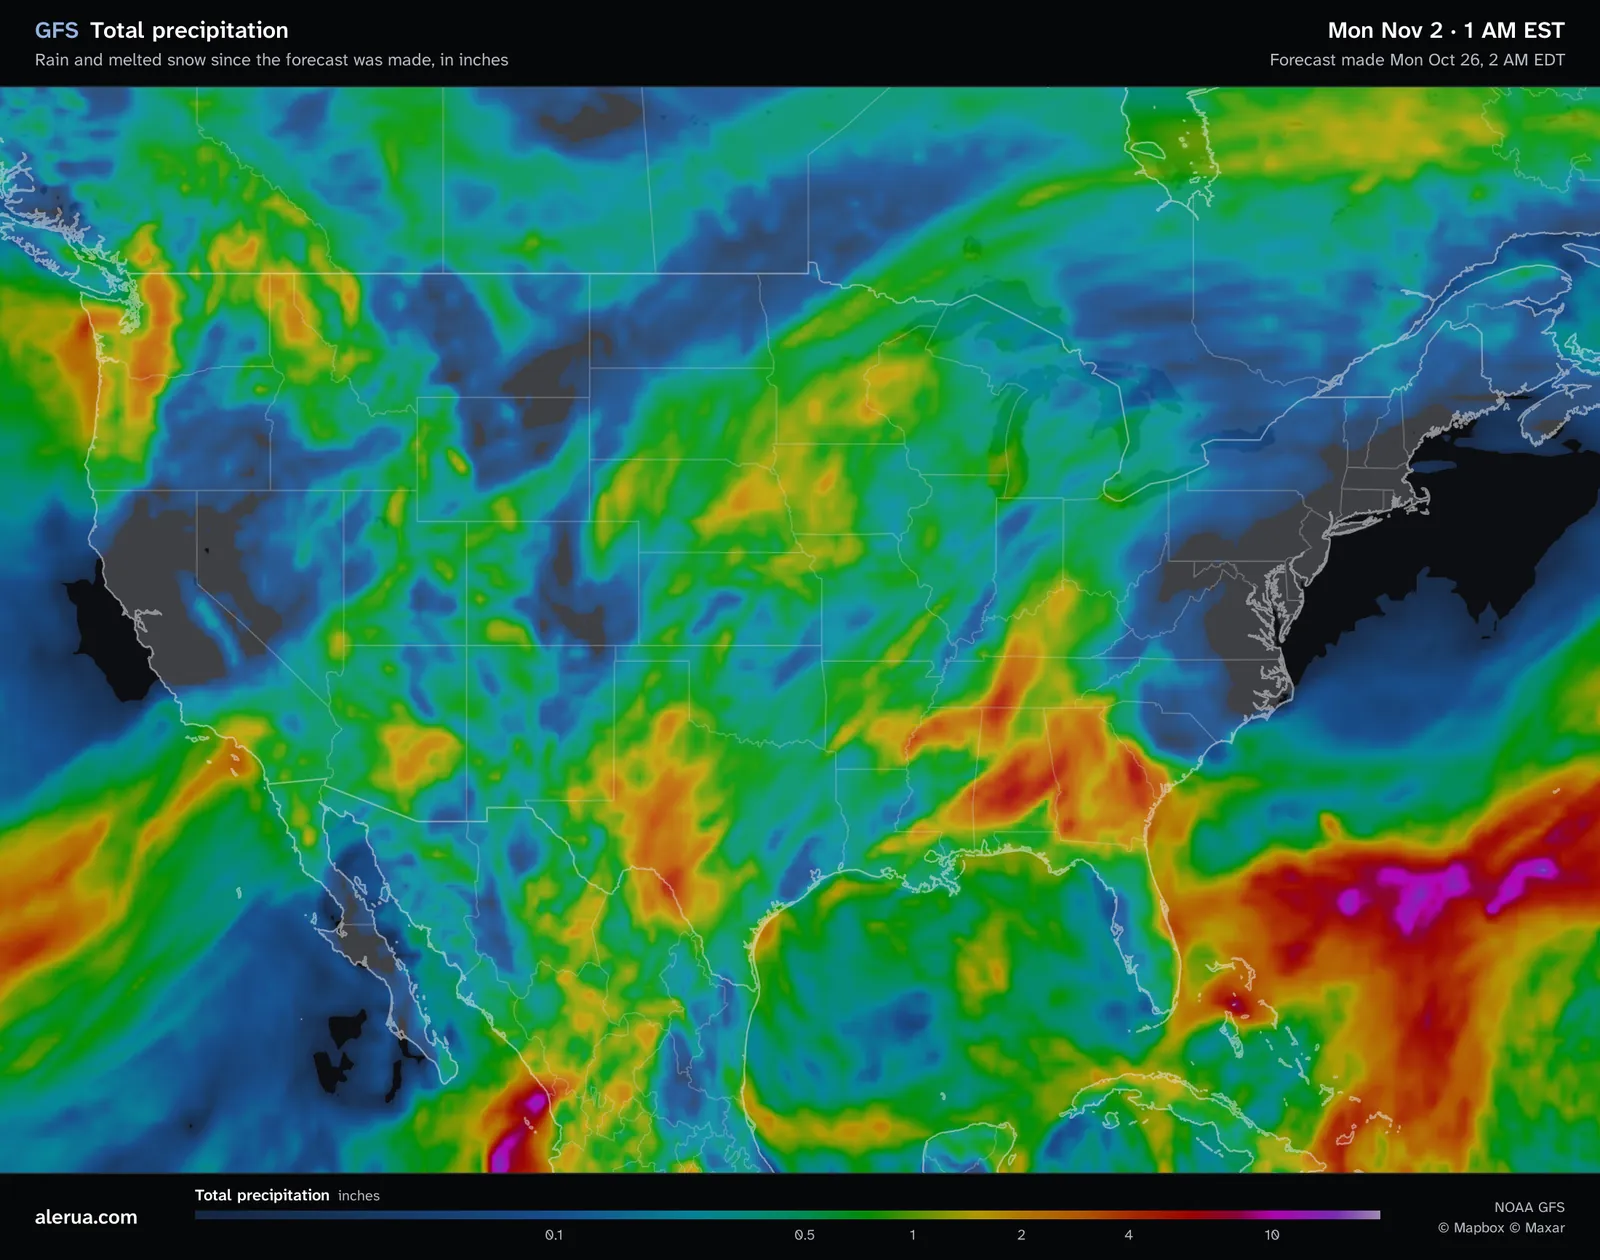
- 1The water under the heavy snow, an inch or two.
- 2The heaviest totals on land, with no snow on the other map.
Water is the steadier of the two numbers. If the model has the water right, the depth of snow depends on the ratio, and you can scale the snow map yourself: 5 to 1 halves its inches and 20 to 1 doubles them.
Mountains, and what the map leaves out
The GFS has a grid point every 0.25 degree, about 28 km (17 miles). A ridge and the valley beside it share a grid cell, so mountain snow appears as soft blobs that follow the model’s smoothed terrain and not any one slope. The map shows snow that falls, not the depth on the ground, and melting, compaction and wind are not in it.
It is also one run of the model. A few degrees decide between rain and snow, and the next run can move that line, as in why forecasts are so often wrong. The forecast time is in the corner of the map. Compare it with an earlier run: totals that hold still from run to run are more believable than ones that jump. For a particular town, follow its National Weather Service forecast.
Keep reading
- Forecast mapsHow to read a GFS precipitation mapThe rain, snow and sleet colors, the six-hour average rate, the pressure lines and the 540 line.
- Forecast mapsHow to read a GFS temperature mapThe color scale, the dashed 32°F line, and how night, day and mountains change the map.
- Winter weatherHow to tell rain from snow on radarWhy the colors look alike, how the correlation coefficient shows melting, and what the beam misses near the ground.
Further reading
- Mount Washington Observatory: snow-to-liquid ratio
- NWS Weather Prediction Center: snow forecasting
- NOAA: the Global Forecast System
Forecast maps from NOAA’s GFS model. Base map © Mapbox © OpenStreetMap contributors © Maxar.