 Alerua
Forecast maps
How to read a 500 mb map
What the height lines and the shaded vorticity show, and how to find the troughs and ridges that steer the weather.
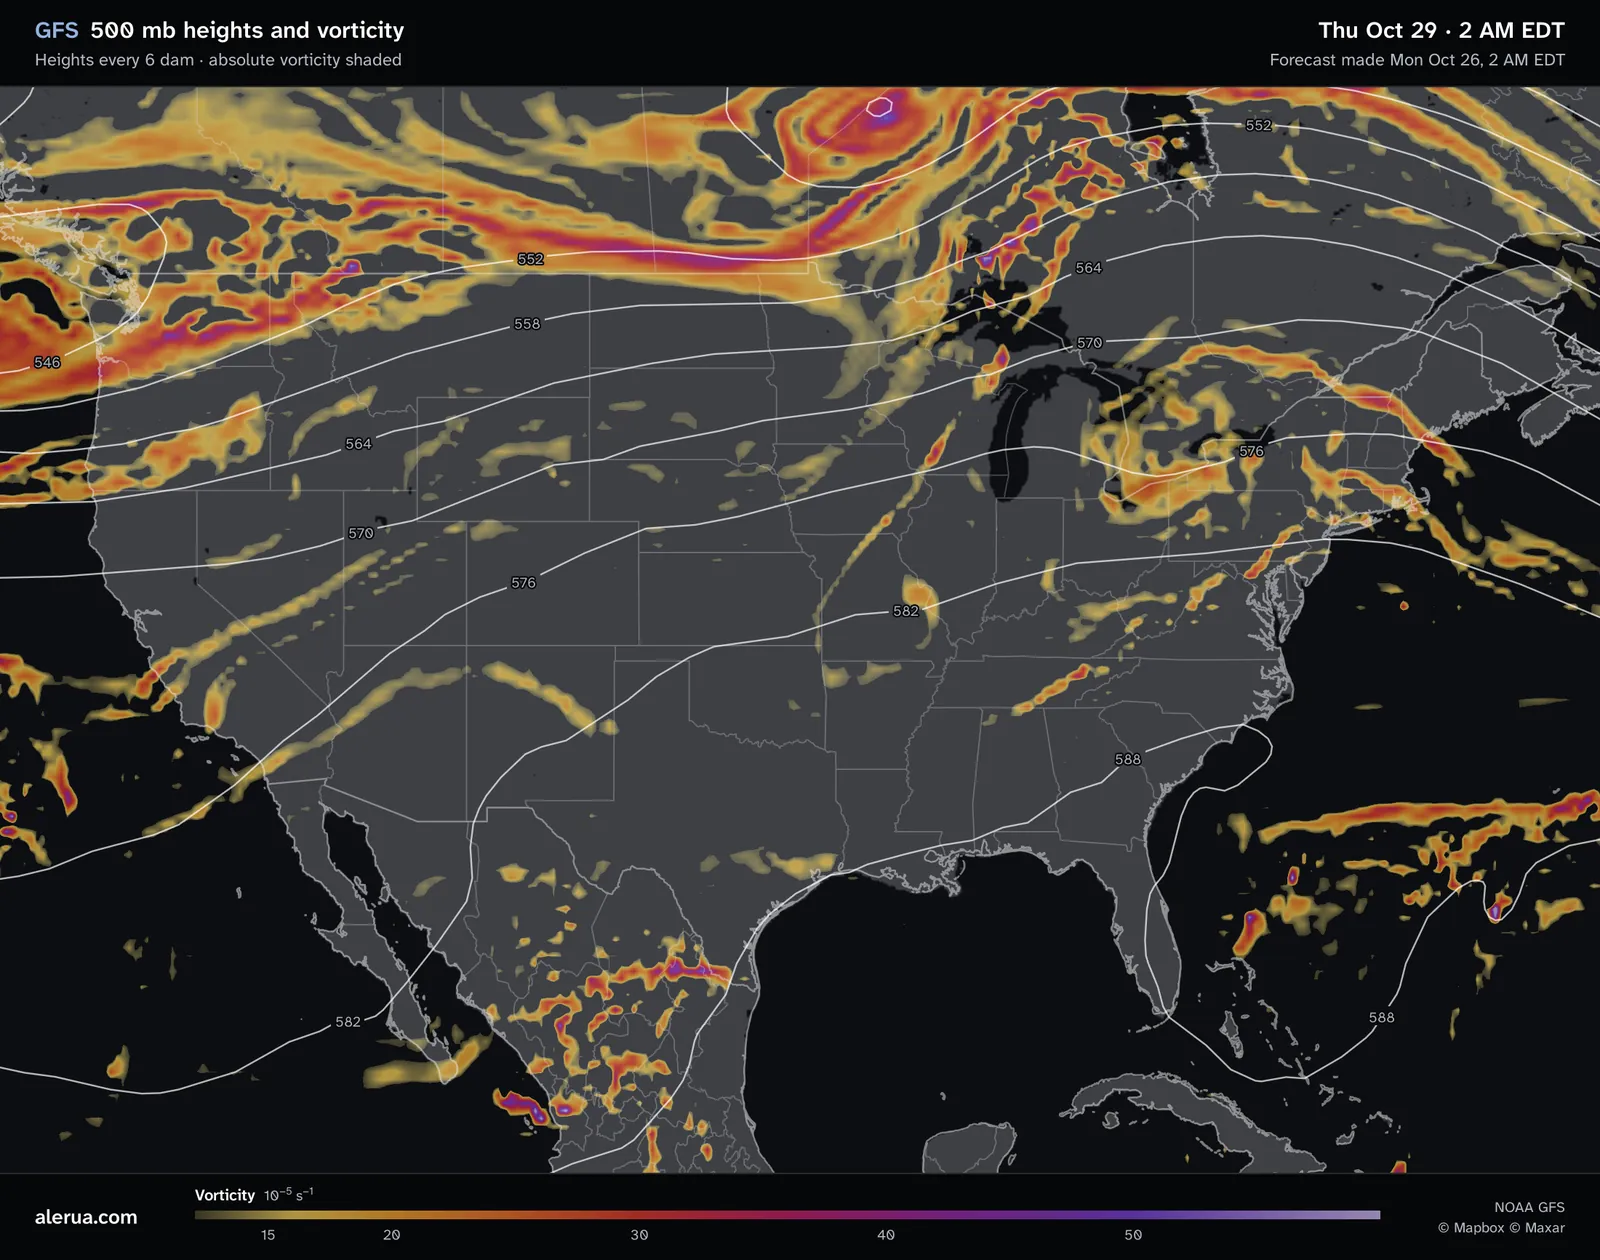
- 1A ridge over the Southeast: the 582 and 588 dam lines bend north.
- 2A trough in the west, where heights fall to 546 dam.
- 3A closed low with a purple vorticity center.
- 4Lines close together, so fast wind.
- 5A streak of vorticity over the Midwest.
What 500 mb means
A pressure level is a surface where the air pressure has the same value everywhere. At 500 mb (the same as 500 hPa) the pressure is half the sea-level value, about 5,500 meters or 18,000 feet up, in the middle of the atmosphere according to NOAA. The map shows how high that surface sits, in decameters (1 dam is 10 m), so 564 dam is 5,640 m. The white lines are drawn every 6 dam. Forecasters study this level because it is near the level where air neither piles up nor spreads out, so the map shows the flow that steers storms without the clutter of the ground.
The surface sits higher where the air under it is warm and lower where it is cold, the same idea as the thickness line on the precipitation map.
Troughs and ridges
Wind at this level blows along the lines, not across them, with the lower heights on its left. Over the United States that usually means from west to east. Lines close together mean fast wind and lines far apart mean light wind.
To find them, follow one line across the map. Where it dips toward the equator, the pattern is a trough: a valley of low heights and cool air. Rising air is found east of a trough and sinking air west of it, and the stormiest weather lies on its east side. Where the lines bend toward the pole it is a ridge, a dome of high heights and warm air that usually brings clear, stable weather. A small, sharp kink in the lines is a short wave, and a ring of lines is a closed low. Troughs and ridges move along with the flow, and the weather goes with them.
The shading: vorticity
Vorticity is the spin of the air. Absolute vorticity adds the Earth’s own spin, which is greater toward the poles, to the spin of the air relative to the ground from curving and shearing flow. The map counts it in units of 10−5 per second. The shading starts faintly near 12, turns orange near 20 and red near 30, and is purple above 40.
The bright streaks and spots are short waves: small kinks in the flow that travel with it. Over the United States air generally rises east of a vorticity maximum and sinks behind it, and rising air makes clouds and rain possible. The National Weather Service adds that high vorticity does not guarantee strong lift.
From 500 mb to the ground
The precipitation map for the same moment is below. The 1006 hPa low in northern Ontario lies under the closed low on the 500 mb map and its purple center. A band of rain runs southwest from Lake Superior to Missouri, the same way as the streak of vorticity over the Midwest and close beside it.
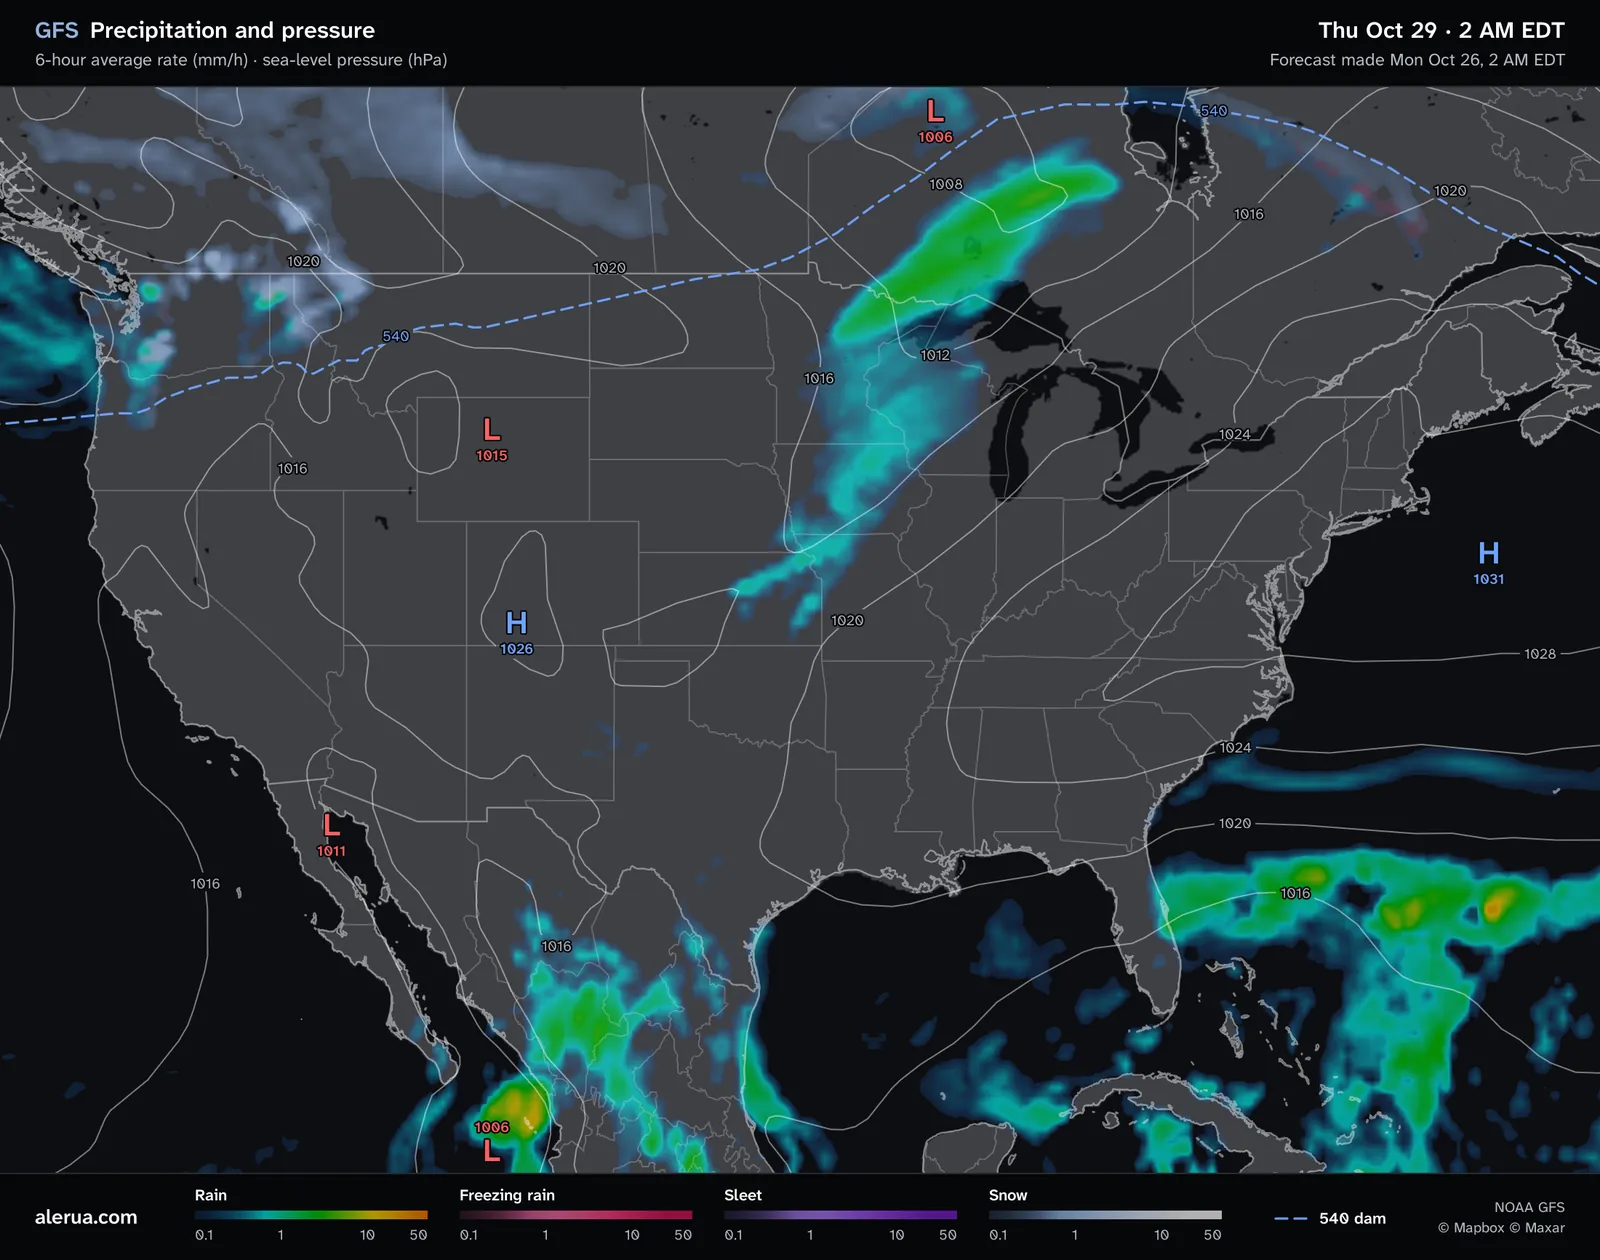
- 1A 1006 hPa low at the surface.
- 2A band of rain from Lake Superior to Missouri.
The 500 mb map shows nothing about moisture or the air near the ground, which decide whether the lift makes rain. Read it with the precipitation map, and with the next run, which may differ.
Keep reading
- Forecast mapsHow to read a GFS precipitation mapThe rain, snow and sleet colors, the six-hour average rate, the pressure lines and the 540 line.
- HurricanesHow to read a hurricane forecast mapThe cone, the colored model lines, and what the strength colors and categories mean.
- ForecastsWhy weather forecasts are often wrongWhy the same hour is forecast differently from one run to the next, and what a rain chance means.
Further reading
- NOAA Science On a Sphere: 500 mb heights
- NWS Houston: vorticity
- NOAA JetStream: constant pressure charts
- NOAA: the Global Forecast System
Forecast maps from NOAA’s GFS model. Base map © Mapbox © OpenStreetMap contributors © Maxar.